Showing posts with label Kerala. Show all posts

Saturday, August 30, 2014

Kerala Rainfall Toppers from 01.06.2014 to 30.08.2014


Kuttiyadi is the wettest placed in Kerala in this SWM

in mm (min 2300 mm)
  1. Kuttiyadi, Wayanad - 4470
  2. Pambla, Idukki - 3280
  3. Vadakara, Kozhikode - 3010
  4. Vythri, Wayaand - 2915
  5. Irukkur, Kannur - 2900
  6. Piravom, Eranakulam - 2715
  7. Neeriyamangalam, Ernakulam - 2565
  8. Idukki, Idukki - 2565
  9. Cheruthazam, Kannur - 2535
  10. Taliparamba, Kannur - 2500
  11. Lower Sholayar, Thrissur - 2412
  12. Thariode, Wayanad - 2348
  13. Peermade, Idukki - 2320
  14. Hosdurg, Kasargode - 2310
  15. Munnar, Idukki - 2300

Sunday, July 20, 2014

Mawsynaram leads the All India SWM Rainfall Toppers from 01.06.2014 to 15.07.2014


This year SWM Toppers are giving a bleak picture compared to last 4 years race. The stand out performer is Mawsynaram which is leading the 2nd place Cherrapunji by 1000 mm, which is still in deficit. But the rains in Karnataka and Maharashtra have picked up after 15th July. Hence, watchout for the month end toppers. There would be drastic change in the toppers.

min 1500 mm

1. Mawsynaram, Meghayala  - 4450
2. Cherrapunji, Meghalaya - 3514
3. Talacauvery, Karnataka - 2311
4. Panbari, Assam, - 1950
5. Kuttiyadi, Kerala - 1928
6. Hulikal, Karnataka - 1909
7. Pookot, Kerala  - 1825
8. Gokarna, Karnataka - 1817
9. Suralbhi, Karnataka - 1770
10. Yadur, Karnataka - 1746
11. Agumbe, Karnataka - 1724
12. Mastikatte, Karnataka - 1723
13. Nilkund, Karnataka - 1708
14. Kogar, Karnataka - 1704
15. Mani Dam, Karnataka - 1652
16. Kollur, Karnataka - 1650
17. Bhagamandala, Karnataka - 1620
18. Pambla, Kerala - 1582
19. Malvan, Maharashtra - 1530
20. Margao, Goa - 1517
21. William Nagar, Meghlaya - 1502
22. Uloor II, Karnataka ~ 1500
23. Gersoppa, Karnataka ~ 1500
24. Amboli, Maharashtra ~ 1500
25. Rongo, West Bengal ~ 1500
26. Amagaon, Karnataka - 1445 (till 14th)

Saturday, July 19, 2014

Close Race between Kuttiyadi & Pookot in the Kerala SWM Toppers from 01.06.14 to 19.07.2014


Its been Wayanad's monsoon so far in Kerala.

in mm

1. Kuttiyadi - 2245
2. Pookot - 2136
3. Pambla - 1741
4. Vythri -  1401
5. Irukkur - 1373
6. Neeriyamangalam - 1318
7. Vadakara - 1310
8. Cheruthazam - 12609
9. Idukki - 1235
10. Kannur - 1154
11. Piravom - 1138
12. Talimparamba - 1131
13. Thariode - 1121
14. Peermade - 1100
15. Kudulu - 1100


Agumbe is loosing its reputation of being the wettest place in Karnataka for many years now. Suralbhi and Amgaon would have also made the list.

Friday, June 20, 2014

Top 15 Kerala Rainfall this Monsoon from 01.06.2014 to 19.06.2014

Last year around similar period Kuttiyadi got around 1500, Vadakara 1400 mm, Kannur 1300 mm, Irkkur 1200 mm and Piravom, Talimparamba, Pookot, Vythri, Kudlu, Lower Sholayar & Hosdurg 1100 mm. This year it all started too bad and as expected Kuttiyadi has got around 600 mm. But it has got around 900 mm less rain than last year for the same period.

Min (400 mm)

1. Cheruthazam, Kannur - 645
2. Kuttiyadi, Wayanad - 617
3. Irikkur, Kannur - 606
4. Pookot, Wayand - 592
5. Kodungallur, Thrissur - 579
6. Kudlu, Kasargode - 487
7. Kannur, Kannur - 484
8. Tavanur, Malappuram - 466
9. Kozhikode, Kozhikode - 454
10. Taliparamba, Kannur - 438
11. Vadakara, Kozhikode - 426
12.Hosdurg, Kasargode - 423
13. Piravom, Ernakulam - 420
14. Peermade, Idukki - 400
15. Panamkutty, Idukki - 400

Friday, September 20, 2013

Kuttiyadi in Kerala crosses 6000 mm for the SWM. Top 15 Kerala Rainfall from 01.06.13 to 20.09.13


in mm

  1. Kuttiyadi, Kozhikode dt - 6100
  2. Panamkutty, Idukki dt  - 4700
  3. Chalakudy Dam, Thrissur dt - 4600
  4. Pookot Wayanad dt - 4223
  5. Vadakara, Kozhikode dt - 4202
  6. Vythri, Wayanad dt - 4118
  7. Piravom, Ernakulam dt - 4023
  8. Peermade, Idukki - 3966
  9. Irikkur, Kannur dt - 3850
  10. Munnar, Idukki dt - 3920
  11. Idukki, Idukki dt - 3620
  12. Neeriyamangalam, Ernakulam dt - 3600
  13. Kannur, Kannur dt - 3437
  14. Taliparamba, Kannur dt - 3400
  15. Thamarasery, Kozhikode dt - 3400
The rainfall data of heavy weights such as Walakkad, Pochippara, Silent Valley, Rajamalai, Lakkidi, Kakkayam, Neelikkal and Sairandhri are not available. These places would have also found a place in the Kerala Toppers.

Monday, September 9, 2013

Kerala Top 15 rainfall in this SWM from 01.06.2013 to 09.09.2013 (100 days)

Kuttiyadi is on the way to cross 6000 mm mark and leads the Kerala toppers, way ahead than others today it got 98 mm rainfall. When all places in Kerala is silent, Kuttiyadi is rocking.

in mm
  1. Kuttiyadi, Kozhikode dt - 5600
  2. Panamkutty, Idukki dt  - 4229
  3. Chalakudy Dam, Thrissur dt - 4064
  4. Vadakara, Kozhikode dt - 3994
  5. Vythri, Wayanad dt - 3789
  6. Pookot Wayanad dt - 3739
  7. Piravom, Ernakulam dt - 3701
  8. Irikkur, Kannur dt - 3670
  9. Munnar, Idukki dt - 3606
  10. Peermade, Idukki - 3462
  11. Idukki, Idukki dt - 3286
  12. Neeriyamangalam, Ernakulam dt - 3269
  13. Kannur, Kannur dt - 3258
  14. Taliparamba, Kannur dt - 3164
  15. Thamarasery, Kozhikode dt - 3053
The rainfall data of heavy weights such as Walakkad, Pochippara, Silent Valley, Rajamalai, Lakkidi, Neelikkal and Sairandhri are not available. These places would have also found a place in the Kerala Toppers.

Sunday, August 25, 2013

Kerala Top 15 rainfall in this SWM from 01.06.2013 to 24.08.2013

Kerala is enjoying the monsoon of its life time even though its is having a dull August. Only Kuttiyadi has crossed 5000 mm mark and leads the Kerala toppers.
 
in mm
  1. Kuttiyadi, Kozhikode dt - 5162
  2. Panamkutty, Idukki dt  - 4000
  3. Chalakudy Dam, Thrissur dt - 3944
  4. Vadakara, Kozhikode dt - 3878
  5. Vythri, Wayanad dt - 3731
  6. Pookot Wayanad dt - 3657
  7. Piravom, Ernakulam dt - 3562
  8. Munnar, Idukki dt - 3514
  9. Irikkur, Kannur dt - 3500
  10. Kannur, Kannur dt - 3188
  11. Peermade, Idukki - 3153
  12. Taliparamba, Kannur dt - 3128 
  13. Neeriyamangalam, Ernakulam dt - 3116
  14. Idukki, Idukki dt - 3074
  15. Thamarasery, Kozhikode dt - 3000
The rainfall data of heavy weights such as Walakkad, Pochippara, Silent Valley, Rajamalai, Lakkidi, Neelikkal and Sairandhri are not available. These places would have also found a place in the Kerala Toppers. 

Wednesday, July 31, 2013

Kerala Top 10 rainfall in this SWM from 01.06.2013 to 31.07.2013

Most of the dams in Kerala are having there having the best storage in over 25 years or so. Only Kuttiyadi has crossed 4000 mm mark and leads the Kerala toppers.
 
in mm
  1. Kuttiyadi Kozhikode dt - 4250
  2. Vadakara, Kozhikode dt - 3435
  3. Chalakudy Dam, Thrissur District - 3178 
  4. Vythri, Wayanad dt - 3141
  5. Pookot Wayanad dt - 3087
  6. Panamkutty, Idukki district - 3071
  7. Irikkur, Kannur dt - 3054
  8. Piravom, Ernakulam dt - 3027
  9. Kannur, Kannur dt - 2825
  10. Munnar, Idukki district - 2800  
The rainfall data of heavy weights such as Walakkad, Pochippara, Silent Valley, Rajamalai, Lakkidi, Neelikkal and Sairandhri are not available. These places would have also found a place in the Kerala Toppers. 

Sunday, June 20, 2010

Rainfall characteristics of Kerala

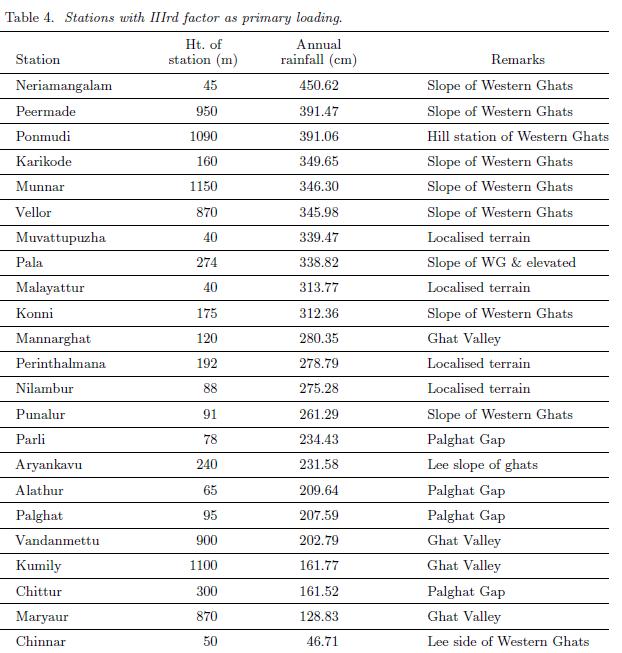
The south-west monsoon current, which brings in most of the annual rainfall to Kerala, gets a forced ascent at the Ghats and the windward slopes experience very heavy rainfall. However, rainfall is not uniformly distributed on the windward slopes and there are pockets of very heavy rainfall and relatively less rainfall. The coastal region of the state also receives abundant rainfall. The results suggest that Kerala can be divided into three unique rainfall regions, each region having a similar covariance structure of annual rainfall. Stations north of 10.N (north Kerala) fall into one group and they receive more rainfall than stations south of 10.N (south Kerala). Group I stations (table 2) receive more than 65% of the annual rainfall during the south-west monsoon period, whereas stations falling in Group II (table 3) receive 25-30% of annual rainfall during the pre-monsoon and the north-east monsoon periods. Group III stations (table 4) with IIIrd factor as the primary loading, i.e., IIIrd factor greater than Ist and IInd factor. The meteorology of Kerala is profoundly influenced by its orographical features, however it is difficult to make out a direct relationship between elevation and rainfall. Local features of the state as reflected in the rainfall distribution are also clearly brought out by the study. The classification of Kerala according to the important factors is given in figure 2.

Group I stations - 75% of the annual rainfall from South West Monsoon

There are 28 rainfall stations in Group I, which can be again classified into 2 according to the contribution of south-west monsoon rainfall (see regions Ia and Ib in figure 2): Stations receiving more than 75% of the annual rainfall during the south-west monsoon, and stations receiving 65-75% of the annual rainfall during the south-west monsoon season. All these stations are situated north of 10.N (north Kerala) and receive more rainfall than stations south of 10.N (south Kerala). This division into north and south Kerala arises from the fact that monsoon rainfall progresses from south to north along the west coast of India and there are differences in the rainfall characteristics between the southern and northern parts of the state. An examination of the monthly rainfall pattern shows that rainfall is highest in June south of 10.N while north Kerala experiences the highest rainfall in July. With each surge in the monsoon current,rainfall is more in north Kerala than in the south and the frequency of surges is higher in July than in June. The active spells of monsoon are also more in July and August. Further, under weak monsoon conditions there is divergence over south Kerala causing little or no rain, while there is convergence resulting in rain over north Kerala on many occasions.

Group II stations - 30% of annual rainfall during pre-monsoon and north east monsoon

South Kerala stations have the second factor as the primary factor and there are 26 stations in Group II. All these stations receive 25-30% of the annual rainfall during the pre-monsoon and north east monsoon season. (i) Precipitation during pre-monsoon is mainly from thundershowers and there is an increased thunderstorm activity in the southern tip of Kerala state from March onwards increasing progressively with the advance of the season. May makes the maximum contribution to the rainfall of the pre-monsoon period (March - May). The south-west monsoon advances over south Kerala between 11th and 31st May in nearly 50% of the years, and this is a contributory factor for the pronounced rainfall maximum over south Kerala during this season.

(ii) Most of the rainfall during north-east monsoon is closely associated with the westward passage of storms and depressions, which are remnants of low pressure systems that move into the Bay of Bengal. The tapering shape of the peninsula and the lower elevation of the Western Ghats in the south are the main reasons for rainfall during this season in south Kerala.

Group III stations - Orographic rainfall, Localized terrain & leeward slope of the Ghats

The meteorology of Kerala is profoundly influenced by its orography. This is reflected as the third factor in the factor analysis. Of the 77 stations, 23 stations have this factor as the primary loading. Even though these stations have the third factor as their primary loading, all these stations do not have the same rainfall pattern and can be classified into three groups. (i) There are 8 stations that receive very heavy annual rainfall (> than 336 cm) and are located on the windward slope of the Ghats. On the windward side of mountains, moist air is forced up the slope, where it cools and condenses, leading to precipitation. These peaks also provide convection points of instability. This instability will be triggered when the orographic lifting is strong enough to force air parcels to ascend to their level of free convection. Thus, the heavy rainfall over the windward slopes depends not only on the elevation of the station but also on the wind velocity perpendicular to the mountain range and on the moist static stability.

(ii) There is a second group of stations that receive normal annual rainfall and has the third factor as their primary loading factor. The local features of the stations are also significant in this factor. For example Punalur a station in south Kerala is surrounded by rocky terrain on its four sides and this station experiences very high thunderstorm activity.

(iii) Stations that lie on the leeward slope of the Ghats and stations situated in the Palghat Gap receive very less mean annual rainfall (less than 224 cm) and load primarily on the third factor. Air flowing across a mountain range will be forced upwards, and therefore it cools and produces local precipitation. When the air reaches the other side of the range, it's been effectively "wrung out" and tends to be dry. This produces a "rain shadow" effect on the lee side of mountains (the side away from the wind direction) where it tends to be dry.

The complex relationship between topography and precipitation in mountainous regions is evident in the pattern of rainfall distribution. A frequency table showing the rainfall and elevation is illustrated in table 5. Stations are classified according to their elevation into 5 groups. The normal rainfall of Kerala for the period of study is 280 cm and stations having rainfall greater than 20% of the state normal (i.e., greater than 336 cm) are classified as excess rainfall stations and those having rainfall less than 20% of the state normal (i.e., less than 224 cm) are grouped as scanty rainfall stations. It can be seen from table 5 that while there are 4 excess rainfall stations with elevation between 500m and 1000m 3 stations with the same altitude experiences only scanty rainfall. Figure 3 illustrates the rainfall versus the elevation of each station. It is evident from the figure that it is difficult to make out a direct relationship between elevation and rainfall. The spatial variability of mean annual precipitation depends upon the topographic factors like exposure of the station to the prevailing wind, elevation, orientation, and slope of the mountain.

Source: Anu Simon and K Mohankumar, Department of Atmospheric Sciences, Cochin University of Science and Technology, India

Photo:-My Collections

Monday, May 10, 2010

Rainfall variation in Windward Vs Leeward sides of the Cardamom Hills (Western Ghats)

The data from Elappara (Windward side) and Bodinayakkanur (Leeward side) were used in this study. The first is instrumental data from the Elappara during 110 years (1896-2005), representing high altitude humid tropics in the Elappara range of cardamom hills (part of Periyar basin in Kerala facing the Arabian Sea). The station is one of the few hill stations in southern India, which has a record of more than 110 years of rainfall data. The station is located in high altitude (1500 msl) mixed tropical forest, which is a major type of forest in Western Ghats, where there is no clear seasonality in environmental factors such as rainfall and temperature. The other data set is from the Bodinayakkanur station located in Tamil Nadu, on the eastern slopes of the cardamom hills facing the Bay of Bengal (falling under semi-arid tropics) and provided 100 years of rainfall data (1906-2005). This rain gauge station is attached with TWAD (Tamilnadu Water and Drainage Board) board, Bodinayakkanur, Tamil Nadu. The Elappara range forms the western boundary of the cardamom hills' reserves (CHR). The Bodinayakanur range forms the eastern boundary of CHR in Tamil Nadu. The Chokkanadu and Kolukku Malai form the northern boundary. To the west of Elappara range, tropical rainy climate prevails. As one moves eastwards, the climate gets more arid, till it is regarded as completely arid in the region between Saptur and Usilampetti ranges. The CHR thus constitutes an area of 334 square miles, with Bodinayakanur and the Elappara are the representative stations for the two extreme ecosystems the humid and semi-arid tropics (Fig 1) respectively.

LEEWARD SIDE

Semi-arid slopes and the plains of Bodinayakkanur are characterized by a high temporal variability of seasonal and annual rainfall. The data show a drastic change in the rainfall pattern from seasonal to decadal scales (Fig 2), but no significant periodicity appears to be present. Over the last hundred years, the contributions of the ISM, NEM and BR (Blossom Rainfall) were 21.3%, 48.1% and 30.6% respectively. The highest rainfall of 2270.4mm was recorded in the year 1958 and the lowest rainfall of 328.5mm was reported in 1983. Mean annual rainfall for entire period was 767.1mm with a coefficient of variation (CV) of 36.9% and standard deviation of 282.8mm. Highest CV was reported for ISM (108.6%) followed by BR (44.30%) and NEM (40.3%). ISM rainfall ranged from19.82 to 1327.8mm while NEM rainfall varied from 83.8 to 773.3mm. BR also varied greatly from 32.9 to 665.4mm. Since CV was higher than 30% for all the seasons, the region experienced more frequent and severe droughts during the period. Higher Precipitation Concentration Index (PCI) (>20) was recorded only in the recent past three decades, which implies very long dry periods for up to 3-5 months. The PCI denotes uniformity of monthly distribution in a year over a particular station or the inter-annual variability. Therefore year-to-year variation in rainfall was considerable and showed definite decreasing trend during the last three decades. The index value was always below 20 for the previous decades.

The mean rainfall of the recent past three decades was well below the centennial average rainfall, clearly indicating decreased monsoon activity. This could be related to increase in tropical deforestation and land use change occurring in the areas surrounding this semi-arid ecosystem, like the Montane cloud forest high waives (Mehamalai) and the cardamom hills during the report period. No alternating pattern of increasing and decreasing rainfall in the decades is seen and no epochal trends in ISM as observed for the rest of the country. The 20, 30, 40 and 50 year running means showed declining trends (2.7 to -3.4 mm per year, with R2 values ranging from 0.42 to 0.85, significant at 95%). This means the future rainfall in the rain shadow slopes of the cardamom hills is likely to decrease. Though historical records say that the eastern slopes have enjoyed good rainfall, in the last century the slopes had lost their thick evergreen forest (90% of primary forest). Whether this has triggered or will trigger changes in rainfall pattern, questionable and sensitivity analysis performed elsewhere showed some teleconnected effects of deforestation in the precipitation change of south East Asia. El Nino and La Nina events have profound influence on the rainfall of this region. The most intense El Nino year in the last century was 1997, when the rainfall was well above the average. Nearly 58% of the El Nino years had below average rainfall. On the other hand 42% of the El Nino years accounted above normal rainfall. Amazingly the lowest rainfall of the last century was in 1983(328.5mm), which happened to be a typical La Nina year, and the effect was spectacular. 70% of the 17 La Nina years brought about below average rainfall and only 30% of the La Nina years experienced more than average rainfall. This shows a changing relationship between semi-arid rainfall climatology and ENSO in this region. Up to many decades ago, the entire area was under cardamom cultivation. For the past 8-10 years, the actual area under cardamom cultivation has shrunk to about 40,000 hectares. Relatively drought resistant crops like coffee and silk cotton are cultivated in the remaining areas. This is indicate the insufficiency of rainfall on the eastern and northern borders of CHR, and the severity of aridity is advancing towards up in the cardamom hills' reserves into the state of Kerala.

WINDWARD SIDE

In our analysis for the period (1896-2005) (Fig 4) the highest rainfall of 7000 mm (1961) was reported. This could be the second highest rainfall in the leeward hill slope of south-Western Ghats in peninsular India after Shimoga in Karnataka where in 8000 mm in a year was received. Careful study of the long term climate record has shown that even seemingly modest fluctuations in rainfall can create havoc in vulnerable societies. Orographic lifting favors the windward to the leeward side ofmountains for convection. However, a close examination of other gauge stations data of the cardamom hills (10-20 years data) indicate that the constant high rainfall (>5000mm in a year) is received near Anaimudi peak (2694 msl). The putative reason for the rainfall maximum in these mountains could be attributed to the strong convection, which undergoes diurnal cycle in which these mesoscale mountains play important role. However, the studies on the reasons for local rainfall maximum need careful observation and analysis besides understanding the physics behind convection-circulation interaction in the mesoscale mountains. The inter annual variations in the monthly rainfall values are very large; for example the values for January and February changed by as much as a factor of two or more from one year to another. The lowest rainfall during the period was reported in 1987 which was one of the two most intense El-Nino years in the world.

There was a strong association of El-Nino phenomenon with below average rainfall (67% of the El-Nino years), indicating a good ENSO relationship. In the case of La-Nina years, fifty per cent of the years enjoyed excess rainfall and rest of the years were low rainfall years. However, the impact of El-Nino phenomenon was not severe during the first pentad of this century in this mountain range. This shows the relationship seems to have weakened in the recent past. Considering these, the scientists concerned should take precautions in forecasting local climate. The coefficient variation of rainfall (CV) for the entire series ranged from 9 to 27%. The decadal averages for the first three decades (1896-1925) and the last three decades (1976-2005) studied, reported values less than the annual mean (5000 mm) for the whole period (1896-2005). Only during the middle period (1926-1975), the decadal average rainfall did exceed the series annual mean. Interestingly the strongest El-Nino years (1997-1998) had received (5120 mm) fairly well above the annual mean. Since 1896, of the total El Nino years, only ten years each in El-Nino and La-Nina years had envisaged less than average. Otherwise all other El-Nino and La-Nina years found to be more than the annual average (5000 mm). These results are found to be for and contradictory to the results reported for many regions of varied environment in India Therefore, extreme rainfall anomaly can occur even in the absence of strong ENSO events, thus uncertainty in ENSO effects is quite large from one environment to another even that are close to each other. The production trend of major spices and plantation crops shows a negative trend for the first one and half a pentads (2000-2007) of this century. Cardamom reported a maximum percentage change of -12.5.1% followed by black pepper (-10.0%) in CHR. In particular, tea production in the cardamom hills has gone down significantly reporting a percentage change of -20% during the recent past seven years. Therefore, this unhealthy trend of production of specific crops is certainly due to the change in the climatic condition which affects both quantity and quality of crops.

Though at this point in time the cardamom hills receive more rainfall than the crops require (for the successful production of tea and cardamom), in the near future the cardamom and tea ecosystem hydrology may get affected as the demand for water is expected to raise many fold. Already many stream flows have been found to decrease and become short lived. Thereby, the ecosystem degradation could be more pronounced at than the present level because cardamom is very sensitive to drought conditions. The most semiarid eastern slopes of the cardamom hills are experiencing down ward march of rainfall. Under the decreasing rainfall pattern coupled with continuing atmospheric warming scenario, the near future could jeopardize the agriculture and sustainable development in this resource (water) poor semi-arid ecosystem, and the coming years could be highly challenging to climate and agriculture scientists as the demand for water would increase by 20-80% in this densely populated valley. Already half a million people from the eastern slopes have moved to western slopes in search of livelihood and the eastern slopes now look like a desert, with at least100 sq.km area (Thevaram- Bodi tract)which have been rendered into a desert like system. Immense ecological degradation and dangerous climatic variability of cardamom agriculture has already been an immutable truth elsewhere in the world. Therefore, understanding rainfall variability in these limited ecosystems is important.

Source:M.Murugan, V.Mukund, R.Ramesh, M.B.Hiremath, A.Josephraj kumar and P.K.Shetty for Caspian Journal of Environmental Sciences, University of Guilan, Iran
Photo:-My Collections