Sunday, August 29, 2010

Debate - Rainiest places in the world

Source - Helium - Effie Moore Salem

Most people agree that the rainiest places on earth are Cherrapunji, India, Bosnia/Herzegovina, Australia, Colombia, in the Cameroon Mountain area of Africa, Kauia, Hawaii. Interestingly, I learned while researching that there is a difference between the rainiest places and the wettest places on earth. One would think that the water falling down would soak the soil to a point of saturation that could be called wet; but apparently not

It must be then that in some places the rain falls but it either runs off quickly - water runs from high to low when cool - or it is quickly evaporated into the atmosphere by the sun. Adding to that would be the wind currents that could divert the rain farther away from its downward thrust. How do the selected areas get nominated for the rainiest, the driest, having the longest drought and so on? It is the yearly rainfall averaged that gives them this distinction. In Tutunedo, Colombia the average rainfall is 463.4 inches. There it probably does not rain every day, but when it does it produces more water, In Mount Wai-Ali'Ali'in Kauai, Hawaii it rains on the average 350 days out of 365.

Opposite these facts are some no-rain statistics: From October 1903 to January 1918 it did not rain in Africa, Chile. That means that for fourteen years they were without rain. A similar but lesser deprivation happened in the US October 12th 1912 to November 8th, 1914 in Bagdad, California. The highest annual rainfall in Europe is Crkvica, a little town near Sarajevo in Bosnia.

Columbia is a wet country since it has much rainfall and apparently most of the rain is contained where it falls. Meteorologist explains it this way and label the phenomenon mega diverse. What that means is the country has mountains, deserts, tropical regions, steppes - flat lands amidst mountainous regions - giving it the right kind of weather for rain. In particular, Andaguya, a Colombian town that is on the equator and has an almost constant temperature year round. They get lots of rain. Yet, elsewhere in Colombia, there's not a drop to drink although they have a record rainfall. Quibdo, Columbia, a lowland area near the Panama border, a gateway between that country and South Central America has a record rainfall but has water shortages.

Cameroon, Africa, near the Cameroon Mountains averages about 400 inches of rain a year in some parts. The area is conducive to rain fall with the tropical regions, ocean, forests, grasslands, deserts and mountains. A similar situation happens in India. Meghalya has enough rainfall and is wet but it has little fit to drink. This area holds the record for the most rainfall in one year. In 1860-1861 it was over 900 inches.

Why does it rain daily in the wettest place in the world? In Mount Waialeala Kauai, Hawaii has special place for rain. It all related to geological conditions with a conical shape, is near an ocean and has the perfect trade winds that are conducive to rain. Llora Colombia has coastlines on the Pacific and Caribean Ocean is, according to weather watcher, a geologic freak with a daily 1.5 inch rainfall. It holds the honor of being the world's wettest place.

Source - Helium - Susan Smalls

You would expect the rainforest to be one of the rainiest places of the world, but it falls far behind in its average rainfalls. The rainforest minimally receives between 68 and 78 inches of rain a year, while the rainiest places all receive well over 400 inches per year. Perhaps they should rename the rainforests as dryforests in comparison to these wetlands.

The actual rainiest place in the world is arguable. It depends on what factors you take into consideration. Should the rainiest place be the one with the highest average rainfall or should it be the city with the most rainy days? The following three places have all claimed to be the rainiest place in the world, so I'll give you their statistics and facts and let you decide depending on which factors you think should be taken into consideration.

Cherrapunji holds two Guinness World Records relating to rainfall. The first one is the highest rainfall in one year, which was 904.9 inches between August 1860 and July 1861. It also holds the record for the highest rainfall within one month, which was 366 inches in July 1861. On average, it rains about 450 inches a year in Cherrapunji, most of which falls during the monsoon season of their winter months. The immense rainfall of Cherrapunji is caused primarily by the Khasi Hills. The monsoon clouds fly into the town from the Bay of Bengal, and the Khasi Hills then break up and condense the clouds, which leads to the high rainfall.

Mawsynram is located only 9 kilometers west of Cherrapunji, so it shares a similar climate. Here, it rains about 472 inches in an average year, but once again, the majority of this rainfall comes during the monsoon season. The Khasi Hills is what causes it to rain so much in Mawsynram as well, and the continual uplift of air over the hills makes the rainfall continuous during the monsoon season. One problem with Mawsynram is that it does not have its own meteorological office. Because of this, it is hard to obtain official records to prove that it is one of the rainiest cities, so Cherrapunji is often considered wetter than Mawsynram.

Mount Waialeale is clearly not a place you would want to honeymoon, since it rains up to 350 days a year here. In the average year, there is 467 inches of rainfall, but it is a much more consistent rain than the two cities in India. It is definitely the rainiest place in the United States, but it also claims to be the rainiest place in the world. The rain here is caused by the location and shape of the island. Because of where it is located, it is more exposed to frontal systems in the Pacific Ocean during winter. The island also has a circular shape, which allows all sides to be hit by clouds of moisture and moisture itself. Mount Waialeale is also known for its steep cliffs, which cause clouds to rapidly rise and then drop a lot of rain in one area.

As these three places battle it out for the rainiest place in the world, here are a few other rainy spots:
- Tutunendo, Columbia
- Hilo, Hawaii
- Crkvica, Bosnia
- Quibdo, Columbia
- Llora, Columbia
- Debundscha, Cameroon

Source - Red Orbit

Depending on the region, precipitation derives from different areas and can vary greatly. In the United Kingdom most rain is driven into the country by the south-western trade winds along the warm gulf stream currents. The western coastal regions can receive up to 40 inches of rain per year at sea level, and up to 100 inches in the mountains.

In the United States, the city of Seattle, Washington is well known for its rainy climate. However, despite its rainy climate, the city experiences less rainfall (37 inches per year) on average than New York City (46 inches per year). Seattle does have more cloudy days (201 per year) than New York City (152). The wettest city in the 48 contiguous United States is Mobile, Alabama, with an average rainfall of 67 inches per year. Alaska’s temperate rainforests of the southeast get an average of 160 inches per year.

Although Australia is the world’s driest continent, more than 300 inches of rain falls on Mount Bellendon Ker in the northeast each year. 472 inches were recorded in the year 2000. Melbourne’s climate is similar to that of Seattle, Washington in the USA, but only gets about 25 inches per year. Sydney receives an average of 48 inches of rain per year.

Cherrapunji, a town on the southern slopes of the Himalayas in Shillong, India is one of the wettest places on Earth. The average annual rainfall is about 450 inches per year. The highest recorded rainfall was 904.9 inches in one year in 1861. Although Mawsynram, Meghalaya, India has an estimated yearly rainfall of 467.4 inches, Cherrapunji is known as the wettest, as rainfall records were never supervised properly at Mawsynram. It should be noted that Cherrapunji is also considered the wettest area on Earth as most of its rainfall occurs during the monsoon seasons.

The town of Lloró, situated in Chocó, Colombia, is considered the place with the most rainfall, averaging 523.6 inches per year. Along with Cherrapunji in Asia, the town of Tutunendo in Colombia, South America is also one of the wettest on the planet. In 1974 the town recorded 86.3 feet of rainfall, the largest annual rainfall measured in Colombia. Unlike Cherrapunji, which gets most of its rain between April and September, Tutunendo receives rain throughout the year. Tutunendo has an average of 280 days of rain per year, of which 68% of the rain falls at night. Some storms in Chocó have been known to drop as much as 20 inches of rain in one day.

Source - Ratestogo

Before you venture off on vacation or even choose your destination, common sense dictates that you should consult the local weather authority. Many trips have ended in utter ruin because travelers, in their sheer innocence, were oblivious to monsoon season or the prevalence of sandstorms at a particular time of year. So call ahead. Consult an Almanac. And unless you have some specific scientific or sadistic need, avoid these precipitation-prone places. With many at over an inch a day, they clearly rank as the rainiest inhabited regions in the world.

Although the country of Bosnia and Herzegovina is devoid of coastline, save for a scant shore of the Adriatic, it nonetheless receives a fair amount of rain, most notably in Crkvica. The town in Bosnia, just northwest of Sarajevo, consistently receives the highest annual average precipitation in Europe.

Another megadiverse country, perhaps more so than any other on the planet, is Australia. With desert, mountains, ocean and tropical rainforests, the country continent is unlike any other. The area of Bellenden Ker and indeed, the mountain of the same name, is a World Heritage Rainforest zone. A short drive from the city of Cairns, the region is lush, rife with exotic plant and animal life and indeed a victim of mass precipitation.

Colombia proves to be wet all over once again with the town of Quibdo. Over 100,000 people live in the capital of the Choco Department, as the national divisions are known as. On the border of Panama and indeed, the gateway between South and Central America, the department and town receive some of the most zany weather in Colombia. Unfortunate because in addition – or perhaps because of which – Quidibo has some of the worst social conditions and economic track records in the country. In point of fact, despite record rainfall every year, the lowland town still manages to suffer from water shortages.

Cameroon has a reputation for being one of the most exotic and beautiful nations in Africa. Indeed, it encompasses the principal features of the continent on a small scale, with hyper diversity in a region about the size of California. As a result of course, parts of Cameroon receive super heavy rainfall. This tends to be the case when you have ocean coastline, tropical forests, grasslands, deserts and mountains within close proximity to each other. At the base of Mount Cameroon and within plain view of the Bight of Biafra, Debundscha receives over 400 inches of rain a year.

Another region with rainfall levels well above 400 inches, Cherrapunji shares another notorious distinction with other wet areas. In utter bewilderment and stark contrast to the weather, the town in the state of Meghalya confronts epic water shortage problems. Geography conspires to make Cherrapunji so wet and also devoid of potable water by the same token. At the confluence of the Kashi Hills and Bay of Bengal, the town receives both north and south monsoon showers that pound the area in a flash, only to flood down the plains of Bangladesh. No suprise then that Cherrapunji holds the record for most rainfall in one year at over 900 inches back in 1860-61.

Another village in the Kashi Hills in the state of Meghalya, Mawsynram proves once again that India is a complex and diverse country. A quick drive from Cherrapunji, the town records indicate more annual rainfall, although disputes about data accuracy have been rife as both regions fight for rainfall supremacy. Whatever the case may be, Mawsynram appears to have a more favorable – or is that cursed? – position in terms of proximity to the Bay of Bengal and steep incline of the Kashi Hills, which allows humid, moist air to ascend and in turn, blanket the area with rain.

Although not exactly a residential area, the region around Mount Waialeale and indeed the summit, receives a ton of precipitation on a habitual basis. Tourism officials in Hawaii love to boast that this is the wettest place on the planet, although some in India and Colombia take issue with the claim. Whatever the case may be, the rainfall in Kauai is notable for the fact that it occurs with such daily regularity. Mount Waialeale bears the brunt of the precipitation because of a conical shape and pure geographical position relative to the ocean and trade winds. Although open to tourism, there are obvious physical impediments here due to the amount of rain that falls every day. In other words, the ground is super wet.

The town and municipality of Lloro is another area within the Choco Department of Colombia prone to rain. A lot of rain. With coastlines on the Pacific and Caribbean, unique in the country, the area is an ecological freak of sorts and as a result, the victim of zany phenomena. Average annual precipitation in the town of Lloro is 523.6 inches, which ranks it first in terms of wet world zones. With over 7,000 inhabitants, one has to wonder how people here cope with almost 1.5 inches of rain a day.

Source - Dandantheweatherman

Weather records have been kept for years and years at all sorts of places so you'd have thought it would be really easy to discover where the wettest place in the world is. Guess again - meteorologists can't for the life of them seem to agree on where the wettest place in the world is! Of course the thing to remember is that we're looking at average rainfall, i.e. consistent wetness, rather than one year with a huge rainfall total. Of course other ways of judging the wettest place in the world would be to look at the number of days or hours with precipitation. Sadly I've not unearthed much in this department - De Bilt in the central Netherlands gets on average about 604 hours precipitation per year (there's 8,760 hours in a year) and in 2001 had 800 hours precipitation. Here precipitation falls on around 200-250 days per year. For the time being, however, it's where the greatest average rainfall in the world is that we're interested i

Mount Wai-‘ale-‘ale, Kauai, one of the Hawaiian islands - the weather station here is 1569 metres high and records on average 13,000mm to 11,684mm rain per year, depending on which source you believe. Either way this is really wet!!!!! Rain falls on between 335 and 360 days per year, again depending on which source you believe. Nearby sea level sites, meanwhile, record around 500mm rain per year.

As you can see, sources vary considerably as to how much rain falls here. Bodin (1978) quotes 11,684mm per year figure as being the 1912-45 average, an average that quite possibly will have changed since then, whilst The National Climatic Data Center quotes this figure as a 30 year average there, but fails to mention which 30 period was covered. The Weather Network and The Guiness Book of Weather Records (Holford 1977) quotes 11,455mm rain per year, whilst Ahrens (2000) quotes 11,680mm as the average annual rainfall at Mount Wai-'ale-'ale and Kroll (1995) claims 13,000mm falls there.

Similarly, The Weather Network and the Guiness Book of Weather Records quote 335 days with rain here whilst Simons (1996) suggests that rain falls on an incredible 360 days per year here. Nice.

Mount Tutenendo, Columbia - records 11,770mm to 12,045mm rain per year, again depending on which source you choose to believe (Simons 1996, Focus Magazine 1997), and there's just 275mm difference between sources.

Lloro, Columbia - estimated 13,299mm rain per year (Raikhel 2000). According to The National Climatic Data Center this is an estimated amount and in fact Quibdo in Columbia, which is at a lower altitude than Lloro, is with an average annual rainfall of 8,991.6mm rain South America's wettest place.

Cherrapunji,north-eastern India - was thought for many years to be the wettest place in the world. Here 10,820mm rain (Holford 1977) falls on average in a year, well short of the amounts that fall at the other contenders. Unlike Hawaii and Columbia where the rain falls throughout the whole year, Cherrapunji gets most of its rain during the 'south-west monsoon', or wet season, between June and August. Cherrapunji does hold the record for the wettest month on record, recording 9,296mm in July 1861. Actually, between 1860 and 1862 Cherrapunji was incredibly wet; between August 1st 1860 and July 31st 1861 (which overlaps parts of 2 wet seasons) 26,467mm rain fell. In the calender year 1861 22,987mm rain fell, of which 22,454 fell between April and September.

Mawsynram, India - is quoted by the The National Climatic Data Center as having an annual average rainfall of 11,871mm and 11,877mm by BBC Weather, more than any other contender except Lloro in Columbia. Mawsynram is just a few kilometres away from Cherrapunji.

Tuesday, August 24, 2010

Leh got 240mm in 24 hrs on the fateful day - GSI

On the night of 5th and 6th August 2010, between 00:00 hrs and 00:30 hrs, intensive rainfall followed by massive cloudburst in high altitude terrain of Leh (3505m), triggered numerous debris flows, mud flows (earth spreads) and sand flows. These widespread, composite flows in the over saturated slope forming materials caused 182 deaths including that of 3 foreign tourists, damaged 607 houses, breached all major communication networks to Leh town besides inflicting an unaccountable loss of livestock and agriculture fields. The disaster caused severe damage to the settlements in parts of Leh town, Sabu village, Choklamsar, Leh airport area, Nimu, Ney and Bazgo area around the town.

The Deputy Director General, Geological Survey of India, Northern Region, Lucknow nominated S/Sh. VK.Sharma, Sr. Geologist, Ajay Kumar and Pankaj Kumar Geologists to investigate the affected area. The GSI team visited the area from 11th August to 16th August, 2010. Trans Himalayan region, known for its cold and desert type climate owing to scanty rainfall and high sun radiations, had never witnessed such a disastrous scenario since the recorded historical times, notwithstanding the fact that cloudbursts occur frequently in the higher reaches of the mountains.

The Leh region represents a broad U shaped glacial valley of Indus river sandwiched between the lofty high ranges of Ladakh in the north and Zanskar in the south. Huge piedmont fans, river terraces, recent flood plains with prominent point bars, lateral bars and Aeolian deposits are the major geomorphic units of the terrain. Lacustrine deposits, indicating neotectonic activity, at places, have been observed near Sputik, Phyang and Nimu localities. Geologically, the affected region is occupied by Ladakh Granitoids and Quaternary sediments of glacial, fluvio-glacial, lacustrine, alluvial and Aeolian origins.

Widespread occurrence of varied, unconsolidated Quaternary drift deposits perched over gentle to fairly steep slopes are susceptible to mass movement under conditions of heavy saturation. Unprecedented rainfall of the order of 240 mm within 24 hours on account of cloud bursts in the Leh region during 4-6 August 2010 caused excessive mass movement of drift deposits and over spilling of the banks of the streams. Huge quantities of debris charged water moved in high energy regime destroying everything in its run out path.

In Leh area, the damage was confined in the catchments of Shaksaling nala, flowing from an elevation 3800 m to 3410 m. The debris flow mobilized and damaged the settlements, Bus Stand building, BSNL buildings, Hospital Complex, Radio Station, etc. in its 3 km run-out distance.The Sabu nala section, located about 11 km east of Leh, was affected the most by the cloudburst. The prolonged and heavy rainfall that reportedly lasted for 30 minutes raised the water level by about 10-15 feet and triggered the movement in slope debris. Water charged with debris, wooden logs and huge blocks of granite choked the course of the nala at bridge points near villages Zong, Myek and Ayu Sabu. The village settlements, forest and agricultural fields were damaged on account of over spilling of water mixed with debris and boulders, which flowed out with an appalling velocity, resulting death of 11 persons in Sabu village. When the debris blockades at bridge points breached due to further on-gush, the debris flow spread out in the downstream commands. This phase, lasting for about 30-45 minutes, was, in fact, the major cause of devastation to Choklamsar village, ITBP Camp, Leh-Manali route, New Choklamsar market, etc. It is reported that bodies of 48 people were recovered from the debris from these areas. A pile of debris upto 4 m high was observed at Leh–Manali road near New Choklamsar village. The debris further moved and spread along the road before falling into Indus river. Typical accumulation lobes of finer fraction of debris material were observed at tail end of the flow. The total run out distance of the debris flow from the epicenter of the cloudburst in the Sabu nala to the tip of the debris flow was of the order of 10 km. The maximum lateral spread of debris flow has been observed to be about 2 km. The morphological dimension of the debris flow and lateral spread belies the current figures of deaths and damages in the area. Stokma nala, flowing adjacent to Stokma village, was blocked by huge boulders and wooden logs resulting in diversion of the nala course towards the right bank in a geomorphic depression /dry nala. The Druk Padma Karpo Institute, generally referred to as “Ranchoo’s School”, located within the flow direction of mud/soil/silt has been affected. The surge of mudflow entered the classrooms of the School.

The airfield of the Leh, one of the highest airports in the world, is uniquely situated in a ‘U’ shaped wide valley. The granite hills around the airport area are covered by a pile of piedmont fans, lacustrine deposits and top layer of Aeolian sand. The field area is on the fluvio-glacial deposits. The cloudbursts affected the airfield when sand /Aeolian deposits and a section of terrace spread out over the air strip, thereby hampering the air traffic, and to an extent, the rescue operations.

The natural depressions on both sides of nala and low lying dry streams, where sprawl of settlements have grown, were in general, the worst affected sites of devastation; the higherelevation of slopes were the least affected locations. The mass movement in geologically fragile Quaternary sediments under unprecedented saturated conditions was largely responsible for the devastation. The selection of sites for rehabilitation in the area should, therefore, consider the local geomorphic setting, the nature of slope forming material and potential run-out zones of mass movements.

Sunday, August 22, 2010

Its NE-monsoon week for Tamilnadu - Widespread rainfall in the state

Coimbatore
------------
After a long disappointment over the delayed or inadequate rainfall during the South-West monsoon, a downpour lashed Coimbatore city and suburbs on Friday night.

Rainfall in mm during the last 24 hours till 8.30 a.m. on Saturday: Annur - 6, Peelamedu - 46.3, Mettupalayam - 50.2, Pollachi - 32, Periyanaickenpalayam - 40, Tamil Nadu Agricultural University - 48, Sulur - 37, Coimbatore South Taluk - 56, Thondamuthur - 30, Valparai Taluk - 8, Chincona - 4 and Chinnakallar - 3. Parambiulam - 4, Aliyar - 15.4, Thirumurthy - 5, Amaravathy - 27, Upper Nirar - 3, Lower Nirar - 1, Manacadavu - 46, Sircarapthy - 4, Upper Aliyar - 2, Kadamparai - 2, Uppar - 28, Valparai - 11, Thoonakadavu - 2, Vettaikaranpudur - 22, Pongalur - 28, Pollachi - 32 and Nallaru - 10.

Rain proved to be minimal in the Western Ghats along the catchments of the Parambikulam – Aliyar Project (PAP) reservoirs. Officials said that the rainfall during the South-West monsoon remained inadequate and the reservoirs are yet to reach the brim. The water level in dams on Saturday: Sholayar - 124.49 ft as against the Full Reservoir Level of 160, Parambikulam 47.85 ft as against the FRL of 72, Aliyar 115.80 ft as against the FRL of 120 ft, Thirumurthy reservoir 53.18 ft as against the FRL of 60 ft and Amaravathy had 62.50 ft as against the FRL of 90 ft.

Siruvani, the reservoir that takes care of the drinking water needs, witnessed a downpour. The rainfall in the catchment was 75 mm and at the foothills was 40 mm. The storage is said to be improving considerably. The storage stood at 28.37 feet as against the FRL of nearly 50 feet.

Thanjavur
-----------
Heavy rain lashed Thanjavur and Tiruvarur districts on Saturday. The agriculture department officials said the rain was beneficial for standing Kuruvai crop. According to P.Loganathan, Joint Director of Agriculture, Thanjavur , Kuruvai crop is in the tillering to flowering stage.

The rainfalls recorded in the 24-hour period ending at 8 a.m. Saturday were as follows (in mm): Thanjavur 15.3, Kumbakonam 25.4, Valangaiman 13.5, Ayyampettai 18, Papanasam 61, Thiruthuraipoondi 45.5, Neyvasal Thenpathi 66, Mannargudi 34, Muthupettai 66, Peravurani 14, Vettikadu 19, Orathanadu 41.5, Madukkur 44 and Pattukottai 31.

Nagapattinam
-------------
Torrential rain continued unabated for the second day with the district recording an average rainfall of 21.98 mm on Saturday. Vedaranyam recorded the highest rainfall of 70.40 mm. According to sources at Vedaranyam, the rains brought respite to the herbivores at Kodiakarrai sanctuary. However, flooded salt pans would slacken salt production, sources said. The morning's heavy rains in Nagapattinam block also brought in its first of rain-induced loss with inundation of a fair price shop here.

Rainfall recorded for the 24-hour period upto Saturday 8 a.m. are as follows (in mm): Vedaranyam 70.40 ; Tirupoondi 46; Thalainayar 26; Manalmedu 22; Nagapattinam 15.40; Mayiladuthurai 9 ; Sirkazhi 6; Tharangabadi 3; and Kollidam recorded nil rainfall.

Tiruchi
----------
Several parts of the Tiruchi district received intermittent shower on Saturday, bringing down the temperature. The sky remained overcast throughout the day.

Navalur Kuttapattu recorded the maximum of 43 mm of rainfall in the district.The following were the chief amount of rainfall recorded in other parts of the district during the 24-hour period ending at 8 a.m. on Saturday (in mm): Thuraiyur 36; Kovilpatti 27.40; Samayapuram 25; Ponnaniyar Dam 22; Marungapuri 20.20; Manapparai 17.20; Kuppampatti 15 and Vathalai Anicut 6.60. The district recorded an average of 11.35 mm of rainfall during the period.

Dharmapuri
---------------
Rain lashed Dharmapuri district from Friday night. Karimangalam experienced a maximum rainfall of 245 mm.Dharmapuri district experienced a maximum rainfall of 365 mm. All the lakes and ponds in and around Karimangalam were filled to the brim.

Krishnagiri
—————
In Krishnagiri district, many places received mo

Depression/Cyclone is possible near TN / Andhra coast

GFS Model
==============


NOGAPS Model
==============


IMD MM5 Model
==============


IMD GFS Model
==============


Canadian CMC GEM Model
=====================


NUWE Model
===========


Taiwan Model
===========

Nuwe predicts 250mm in next 4days for chennai


GFS predicts around 150mm


Foreca is little conservative and predicts around 80mm

All India Rainfall toppers from 1st January 2010 - 21st August 2010

  1. Cherrapunji (Meghalaya) - 1140 cm (Annual around 1100)
  2. Agumbe (Karnataka) - 488 cm (Annual over 750)
  3. Gaganbawada (Maharashtra) - 432 cm (Annual over 600)
  4. Shirali (Karnataka) - 351 cm (Annual over 400)
  5. Coochbehar (West Bengal) - 342 cm (Annual around 350)
  6. Passighat (Arunachal Pradesh) - 331 cm (Annual around 450)
  7. Mahabaleshwar (Maharashtra) - 321 cm (Annual over 600)
  8. Silchar (Assam) - 308 cm (Annual around 350)
  9. Honavar (Karnataka) - 307 (Annual over 350)
  10. Ratnagiri (Maharashtra) - 307 cm (Annual around 300)
  11. Buxa (West Bengal) - 302 cm (Annual around 550)
  12. Piravom (Kerala) - 302 cm (Annual around ??)
  13. North Lakhimpur (Assam) - 298 cm (Annual around 350)
  14. Panambur (Karnataka) - 293 cm (Annual over 350)
  15. Mangalore AP (Karnataka) - 292 cm (Annual around 400)
  16. Bhagamandala (Karnataka) - 291 cm (Annual over 600)
  17. Vadakara (Kerala) - 287 cm (Annual around ??)
  18. Karwar (Karnataka) - 282 cm (Annual around 400)
  19. Gangtok (Sikkim) - 280 cm (Annual over 350)
  20. Panjim (Goa) - 273 cm (Annual around 300)
  21. Jalpaiguri (West Bengal) - 268 cm (Annual around 350)
  22. Kottigehara (Karnataka) - 263 cm (Annual around ??)
  23. Harnai (Maharashtra) - 263 cm (Annual around 250)
  24. Mumbai Colaba (Maharashtra) - 263 cm (Annual around 200)
  25. Mumbai Santa Cruz (Maharashtra) - 262 cm (Annual around 250)
  26. Peermade (Kerala) - 256 cm (Annual around 500)
  27. Chinnakallar (Tamilnadu) - 253 cm (Annual around 500)
  28. Kannur (Kerala) - 248cm ( Annual around ??)
  29. Itanagar (Arunachal Pradesh) - 245 cm (Annual around 350)
  30. Matheran (Maharashtra) - 232 cm (Annual around 550)
  31. Kozhikode (Kerala) - 232cm ( Annual around ??)
  32. Kochi AP (Kerala) - 229cm ( Annual around ??)
  33. Dibrugarh (Assam) - 228 cm (Annual around 300)
  34. Valparai (Tamilnadu) - 222 cm (Annual around 350)
  35. Dahanu (Goa) - 215 cm (Annual around 250)
  36. Kottayam (Kerala) - 206cm ( Annual around ??)
  37. Devala (Tamilnadu) - 202 cm (Annual over 400)
Many stations in Kerala, Karnataka, Maharastra, and North East would have crossed 200-250 cm. Its very time consuming in calculating the rankings from the archived data.

Saturday, August 21, 2010

Southwest Monsoon Rainfall till 18th August 2010

This year desert region of Rajasthan & Gujarat have got plenty of rains, even a cyclone in the form of "PHET". The same can be said of south east coast of India (Tamilnadu & Andhra) got above normal rains, it has also witnessed a cyclone in the form of "LAILA". The trend will will continue in August and September.

The two regions which witnessed cyclones are getting heavy rains....does the cyclones had any role to play in this.....!


Top 5 (above normal rainfall)
------------------------------

1.Saurashtra & Kutch - 92%
2.West Rajasthan - 72%
3.Rayalaseema - 55%
4.Coastal AP - 45%
5.Tamil Nadu - 39%

Top 5 (below normal rainfall)
------------------------------

1.Jharkhand - 49%
2.Eastern U.P - 43%
3.West Bengal - 32%
4.Assam & Meghayala - 29%
5.Bihar - 28%

Monday, August 16, 2010

More on Leh Rainfall and cloudburst

13th August, 2010 - Times of India

The cloudburst has again brought out the glaring lack of adequate documentation on such sporadic weather events. J Srinivasan, chairman of Divecha Centre for Climate Change and head of Centre for Atmospheric and Oceanic Sciences, Indian Institute of Science, tells TOI's Jayashree Nandi about the need for extensive research on extreme weather events like the cloudburst. Excerpts:


What do you think of the cloudburst disaster at Leh?
Cloudbursts are events in which high rainfall occur over a very small area, in a very short time span (typically more than 100 mm/hour for a few hours). We do not have much data about this phenomenon. However, such events have occurred earlier in Uttarakhand and Himachal Pradesh. For instance, many people were killed in a cloudburst at Pithoragarh (Uttarakhand) on August 7, 2009. These events are rare in Jammu and Kashmir and hence the Leh cloudburst was unexpected. Extreme rainfall events (rainfall more than 100 mm/day) have increased by 50% during the past 50 years. This year we had floods in Pakistan, Gujarat and now in Jammu and Kashmir.

How long did it rain in Leh and across how much area?
India Meteorological Department data says it rained between 1.30 am and 2 am in Leh on August 6. A weather station near Leh recorded only 12.8 mm of rainfall in 24 hours. These events are extremely localized in an area probably less than 30 square kilometres. In August, the normal rainfall in Leh is 15.4 mm and the highest recorded in this season was 51 mm. But this time, the rainfall was probably much higher than that.

Have such events taken place earlier? Is it similar to 2005 Mumbai floods?
Such events occur every year in mountainous regions. Many events are not reported because of insufficient data. For instance, if it happens in some remote areas of Himachal Pradesh and if there is no a weather station close by and there is no habitation in those areas, the event doesn't get reported. Leh cloudburst is comparable to Mumbai floods because it rained for over 12 hours in Mumbai.

Could this be due to climate change?
IMD observations show that events of extreme rainfall have increased by 50% during the past 50 years. And, most climate models predict that global warming will increase such events. We cannot claim that a specific extreme event is due to global warming although we know that the probability of such events will increase as the earth becomes warmer.

Have any new observations been made on climate science recently?
In March, this year a disputed island on the Bangladesh-India border called Talpatti disappeared completely. Such events will occur more often in the future. The impact of sea level rise will not be seen in one or two years because the changes are slow. Similarly in case of temperature rise, IPCC predicts that there will be three degrees rise in 100 years. So that means a .03 degrees rise every year. We will not notice these changes easily unless we look at the long-term trend.

Do you think our policies are robust enough to deal with climate change?
Global warming will have serious impact on our life within 30 to 40 years. We have to act immediately because the transition from the present fossil-fuel dependent economy to one based on renewable energy will take many decades. Sadly, the vision and leadership on global warming has been lacking.

Sunday, August 15, 2010

South West Monsoon Rainfall Toppers 2010 till 15th August

All IndiaTop Rainfalls, over a limit of 2000mm, from 1st June 2010 to 15th August 2010.
  1. Cherrapunji: 5787 mm (-435)
  2. Agumbe: 4409 mm (-1075)
  3. Gaganbawada: 3840 mm
  4. Shirali: 3272 mm (+262)
  5. Mahableshwar: 3003 mm (-1234)
  6. Honavar: 2826 mm (+225)
  7. Ratnagiri: 2823 mm (+698)
  8. Buxa: 2808 mm
  9. Mangalore AP: 2644 mm(-25)
  10. Panambur: 2638 mm (+91)
  11. Bhagamandala: 2508 mm
  12. Karwar: 2499 mm (+185)
  13. Panjim: 2493 (+382)
  14. Harnai: 2456 mm (+502)
  15. Mumbai Colaba: 2312 mm (+778)
  16. Chinnakallar: 2276 mm
  17. Kottigehara: 2262 mm
  18. Mumbai Santa Cruz: 2219 mm (+512)
  19. Kannur: 2176 mm
  20. Matheran: 2160 mm
  21. Dahanu: 2011 mm (+513)

Tuesday, August 10, 2010

Changing weather pattern signals more rain for Ahmedabad

August 10, 2010 - Daily News Analysis

Amdavadis looking for respite from torrential rains have some bad news — though not for tomorrow or the day after. Weather pattern is changing and the city could be lashed by more heavy rains this monsoon and in coming years as it has been noted in the last decade that heavy rainfall events are increasing in the city.

On August 8, 2010 - 237.4 mm rainfall was recorded in Ahmedabad. The all-time record for 24-hour rainfall in August for the city is 250 mm recorded on August 30 in 1976. In the last decade, Sunday's rainfall was next only to the heaviest 24-hour rainfall ever recorded at Ahmedabad observatory at 325.9 mm on July 14, 2000.

An overview of the past decade shows that the frequency of heavy rainfall in the city has increased from 39 in 1979-88 to 50 in 1999-2008. As the city limped back to normalcy on Monday, it was learnt that the torrential rainfall that lashed the city on Sunday was the highest 24-hour rainfall in the last 10 years. With this, the city has recorded 930.4 mm rainfall till Monday, which is 130 mm more than normal. This figure exceeds the average annual seasonal rainfall in the city. With the change in formation of rain mechanisms, a significant rise in the number of average rainy days in month of July has also been noted. "The total average rainy days during the month of July for Gujarat were 15," said Kamaljit Ray, director of India meteorological department, Gujarat. The average rainy days in the state in July for the last 50 years are 11.

Moreover, for the last three decades, due to climate change, the state gets more rains from Arabian Sea than the Bay of Bengal. With this, a gradual rise in heavy rainfall events and city's average rainfall has been observed by the state's weather office. The city has witnessed a series of heavy rainfalls this season. It received 85.8 mm rain within 24 hours on August 2, 2010 which was also a heavy rainfall event of this monsoon for the city as well as the third highest 24-hour rainfall event in August during the last decade.

Sunday, August 8, 2010

Leh Cloudburst: How much it had rained ??

Source - Wall Street Journal, Hindu Business Line, Wikipedia

Sudden overnight rains caused flash floods in the town of Leh, the administrative center of the mountainous northern Ladakh region that borders China and Pakistan, killing more than 100 people and leaving hundreds injured, AP reported Friday. Many news reports described the downpour as a “cloudburst,” which the Indian Meteorological Department described Friday evening as a “disastrous weather event” in which “rate of rainfall may be of the order of 100mm [millimeters] per hour.”

Reports are that Leh received 48.6 mm rain in 60 seconds. In a special bulletin, the IMD said on Saturday that the high-impact event was so localised that that a nearby meteorological observatory of Indian Air Force (IAF) reported only 12.8 mm of rainfall during the 24 hours ending 5.30 a.m. on Friday. There is no official rainfall figure for the “fatal hours” available since it did not have an observatory in the region.

Comparing the Leh event with the year 2005 drencher over Mumbai, the latter was with two thunderstorms that poured 94 cm of rain in a radius of about 10 km around Mumbai together lasting about 18 hours on July 26 that year. In contrast, Colaba at the southern tip of Mumbai city had only 7 cm of rain during the same period. This is the nature of thunderstorms whose size and scale are small compared to low pressure vortices.

Based on the comparison the true rainfall figure in the affected area in Leh may never be known.
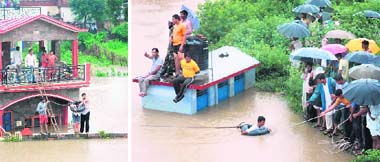
Many buildings crumbled after sudden rains and flash floods in Ladakh.

Rainfall is very, very scarce in the Ladakh region—it’s a dry, high-altitude region—so when it does happen it causes havoc because the houses and towns aren’t designed to deal with it. We were curious to find out exactly how much it had rained in millimeters, and whether this was typical for this time of year (it is monsoon season in India from June through September) and none of the day news stories carried the amount of rainfall.

A meteorologist at the Srinagar office of Indian Meteorological Department, G. R. Rathore, explained that the Srinagar office collected rainfall data for Leh from 1941 to 1981 (he put average annual rainfall for the period at just under 11 centimeters) and then stopped.

From 1981 on Mr. Rathore said that the IMD hasn’t had its own observatories in Ladakh and added that the Indian Air Force runs the three observatories there now. The armed forces have a strong presence in this region, which is part of India’s Kashmir state, because of its location bordering Pakistan and China. The IMD hopes to install one manned rain observatory in Leh by next summer and add several observatories across Ladakh as well, Mr. Rathore said.

According to him, the cloudburst lasted from 1:20 a.m. to 2:20 a.m. on Friday morning but he didn’t have data on how much rain had fallen in that hour because lines between Srinagar and Leh were down. He referred us to the weather section of the Indian Air Force in Srinagar for more information on the cloudburst. But at the Air Force, a senior official said that they weren’t supposed to disclose this information and referred us back to the civilian meteorological authorities. Getting this basic piece of data was starting to feel like a piece of classified information.The average for the whole month of august is 15.4 mm and the highest ever recorded in a 24-hour period is 51.3 mm, in August 1933.

Major Cloudburst Tragedies in India

  • August 31st, 1960 – 50mm of rain in 3hrs in Mandi and Suketi valley, Himachal Pradesh led to 103 deaths.
  • July, 1970 — Cloudburst in the upper catchment area led to a 15 metre rise in Alaknanda river. Entire river basin, from Hanumanchatti near Badrinath to Haridwar, affected; An entire village was swept away.
  • On August 15th 1997, 115 people were killed when a cloud burst came bustling and trail of death are all that is left behind in Chirgaon in Shimla district, Himachal Pradesh.
  • On August 17th, 1998 — A massive landslide following heavy rain and a cloudburst at Malpa village in Kali valley of Kumaon killed 250 people including 60 Kailash Mansarovar pilgrims. Among the dead was Odissi dancer Protima Bedi.
  • On July 16th 2003, About 40 persons were killed in flash floods caused by a cloudburst at Shilagarh in Gursa area of Kullu, Himachal Pradesh.
  • July 6th 2004, At least 17 people were killed and 28 injured when three vehicles were swept into Alaknanda river by heavy landslides triggered by a cloudburst that left nearly 5,000 pilgrims stranded near Badrinath shrine area in Uttaranchal's Chamoli district.
  • On August 16th 2007, 52 people were confirmed dead when a severe cloud burst occurred in in Bhavi village in Ghanvi, Himachal Pradesh.
  • On August 7th 2009, 38 people were killed in a landslide resulting from a cloudburst in Nachni area near Munshiyari in Pithoragatrh district of Uttarakhand.
  • On August 6th 2010, in Leh, a series of cloudbursts left 130 persons dead and over 600 injured in the frontier Leh town of Ladakh region in Jammu and Kashmir.

Record Cloudbursts

Duration Rainfall Location Date
1 minute 1.5 inches (38.10 mm) Barot, Himachal Pradesh, India 26 November, 1970
5 minutes 2.43 inches (61.72 mm) Port Bells, Panama 29 November, 1911
15 minutes 7.8 inches (198.12 mm) Plumb Point, Jamaica 12 May, 1916
20 minutes 8.1 inches (205.74 mm) Curtea-de-Arges, Romania 7 July, 1947
40 minutes 9.25 inches (234.95 mm) Guinea, Virginia, USA 24 August, 1906

Sunday, August 1, 2010

Southwest Monsoon Toppers from 1st June 2010 to 31st July 2010

1. Cherrapunji: 5499 mm (+255)
2. Agumbe: 3406 mm (-833)
3. Gaganbawada: 3370 mm
4. Shirali: 2935 mm (+316)
5. Buxa: 2728 mm
6. Honavar: 2628 mm (+466)
7. Ratnagiri: 2521 mm (+751)
8. Mahableshwar: 2515 mm (-700)
9. Panambur: 2452 mm (+296)
10. Mangalore AP: 2434 mm(+232)
11. Karwar: 2302 mm (+356)
12. Panjim: 2227 (+483)
13. Harnai: 2218 mm (+648)
14. Chinnakallar: 2156 mm
15. Bhagamandala: 2155 mm
16. Mumbai Colaba: 2046 mm (+775)
17. Kannur: 1977 mm
18. Kottigehara: 1972 mm
19. Mumbai Santa Cruz: 1963 mm (+571)
20. Peermade: 1880 mm
21. Jalpaiguri: 1825 (+348)
22. Kozhikode: 1762 (+16)
23. Valparai: 1674 mm
24. Coochbehar: 1655 mm (+120)
25. Dahanu: 1646 mm (+460)

Dehradun receives 364 mm, the second highest after 25 July 1966 when it got 467 mm.

July 31, 2010 - The Tribune

The Meteorological Department confirmed that the rainfall (364 mm) during the past 24 hours on 31st July 2010 was the second highest after 25 July 1966 when it rained 467 mm.

People being rescued in the Morowala area, near Dehradun, on Saturday.
People being rescued in the Morowala area, near Dehradun

Incessant downpour in the past 36 hours wrecked havoc in Dehradun city. Hundreds of houses got flooded as many boundary walls or constructions gave way to the pressure of gushing flood waters.

Residents cross a flooded stream at Nehru Gram and (right) submerged cars in a workshop in Dehradun on Saturday.
Residents cross a flooded stream at Nehru Gram and (right) submerged cars in a workshop in Dehradun.

The encroachers, who had extended their houses on drains or built these entirely on drains, paid for their erroneous acts with their houses getting flooded. The Irrigation Department, which is required to act in matters related to flooding of houses, had no clue to the extent of the damage. BK Tamta, Director Irrigation, said that he would assess the situation soon. Dr Vijayender Pal, counsellor, complained that despite the PWD and MDDA having their own Disaster Management Cell left it all on the Municipal Corporation to manage the crisis. Dehra Dun received 364 mm followed by Kashipur 245 mm over the past 24 hours. Excess rain has been recorded in Bageshwar, Chamoli, Champawat, Haridwar and Naini Tal since June 1 while other districts have received normal rainfall, Anand Sharma, Director, State Meteorological Centre here, said.