Saturday, July 31, 2010

Chennai - After May & June its July's turn to be cooler & wetter

Chennaiites are finding this month unusual — and they are not complaining. Not only has the monthly average temperature fallen , the days are getting good rains. The weatherman attributes this ‘monsoon flavour’ to low pressure formations and some other favourable meteorological systems. “The presence of an upper air cyclonic circulation over the west-central Bay with a southern tilt, a north-south trough over Chennai and a weak upper air system have the potential to bring scattered rainfall” said YEA Raj, deputy directorgeneral, Regional Meteorological Centre, Chennai.

The trough has been present for many days during this month, resulting in light showers. For the common man, it just means he has to take out the umbrella or get drenched, happily. “This evening was almost like a monsoon day with intermittent drizzle. This is a pleasant surprise in the city which sees an extended summer till as late as October. Many residents said the weather was similar to that experienced in winter due to murky sky and intermittent showers through the day. Evening showers in the past few days have left some of the low-level areas, particularly in suburbs, water-logged.

Chennai gets an average of 98 mm rain in July, this July Nungambakkam has registered 155 mm of rainfall. Unlike Coimbatore and Kanyakumari, which are in the windward side of the southwest monsoon, most areas do not benefit from good precipitation. Y. E. A. Raj, Deputy Director-General of Meteorology, Regional Meteorological Centre, said it was unusual for the city to be wet and receive such rainfall during July. Chennai normally receives more rainfall in August and September. While July 2008 and 2009 were comparatively drier, receiving 29 mm and 37 mm, the city has recorded good rains in July in the past.

Friday, July 30, 2010

Karnataka - Copious rainfall ensures steady flow into major reservoirs

Copious rainfall in the catchment areas of the Cauvery and the Kabini have ensured a steady inflow into the major reservoirs in the Cauvery command area since the last 24 hours. This has brought relief to the authorities, who were concerned about the slackening of the south-west monsoon as a result of which the water-level in the major dams—Krishnaraja Sagar (KRS), Kabini and Harangi

Krishnaraja Sagar dam (KRS)

Heavy rain in neighbouring district of Kodagu has augmented the inflow into the KRS. Officials in the Cauvery Command Area Development Authority (CADA) told The Hindu that the inflow into the reservoir was 14,874 cusecs on Thursday morning and it increased to nearly 17,000 cusecs by evening. The outflow from the reservoir was 3,500 cusecs. The water-level in the KRS was 91.30 ft as against the full reservoir level (FRL) of 124.80 ft. The live storage in the reservoir was 8.34 tmcft.

Kabini dam

The Kapila is rising owing to heavy rain in Wayanad district of Kerala which is the catchment area. As a result of incessant rain in the last 24 hours, the inflow into the Kabini dam at Beechanahalli in H.D. Kote increased significantly. The water-level in the reservoir is 2281.5 ft as against the FRL of 2,284 ft. The inflow into the reservoir was 22,271 cusecs at 6 a.m. but increased to 24.750 cusecs by evening.

Harangi reservoir

Harangi reservoir near Kushalnagar was let out into the river on Wednesday, as the water-level reached 2,854.70 ft as against the full reservoir level of 2,859 ft. The inflow increased to 16,646 cusecs. While 9,000 cusecs was released into the river on Wednesday night, this was reduced to 4,769 cusecs on Thursday morning.

The average rainfall for Kodagu district has crossed the 1,000-mm mark this year. According to statistics received on Thursday, the district recorded 1,132.33 mm of rainfall. The figure during the corresponding period last year was 1,754.65 mm. Bhagamandala received 98.40 mm of rainfall between 8 a.m. on Wednesday and 8 a.m. on Thursday. Shantalli in Somwarpet taluk continued to receive the highest rainfall of 156.20 mm during the same period, while Sampaje recorded 93.40 mm, Madikeri 92.40 mm, Srimangala 87 mm, Hudikeri 77.50 mm and Kodlipet 53.20 mm rainfall.

Tungabhadra dam

Water was released into the Tungabhadra Left Bank Canal (TLBC) on Wednesday to facilitate sowing of kharif crops in the command areas of Koppal and Raichur districts. Water will be supplied to the canal till mid-November.Water was also released into the Tungabhadra Right Bank High-Level Canal (RBHLC) and the Right Bank Low-Level Canal (RBLLC) to facilitate sowing of kharif crops in the command areas of Bellary district and parts of Andhra Pradesh. Water will be supplied to the canal till November-end.

This year, the release of water has begun even before the storage at the reservoir has not yet reached to its Full Reservoir Level (1,633 ft.). On Wednesday, July 28, the inflow was at 56.242 cusecs, the water level was 1,613.73 ft. with storage of 43.305 tmcft. of water.During the corresponding period last year, the level of the reservoir touched the Full Reservoir Level with storage of 104.340 tmcft.

Almatti dam

The water levels of various reservoirs built on River Krishna are slowly rising with more rains reported in the catchment area. Almatti dam in Karnataka is almost up to brim and is releasing more than one lakh cusecs of water to downstream Narayanpur dam in the same state. Narayanpur also started releasing water into Jurala in AP as the discharge from Almatti stepped up on Thursday. At Jurala, water level reached 1,043 feet against 1,045-feet full reservoir level. Irrigation officials opened 24 gates at Jurala to let 25,000 cusecs water downstream.

Srisailam reservoir

Increased inflows from Krishna and Tungabadhra saw a sudden surge of water into Srisailam reservoir where the water level touched 835 feet against 885-feet full reservoir level (FRL). This will help the authorities generate more power to ease the ongoing shortage.

Sriram Sagar reservoir

In the Godavari basin, the Sriram Sagar reservoir continues to receive copious inflows from upstream. The water level reached 1,075 feet against 1,091-feet full reservoir level. Singur, Nizamsagar, Yeluru reservoirs also received substantial inflows in the last three days with widespread rains in the catchment area.

Tuesday, July 27, 2010

Jamnagar gets 466 mm & Mandvi 449 mm as Rain batters Gujarat

A record-breaking 466 mm of rainfall was recorded in Jamnagar city in the past 24 hours. Rains continued to lash the city and district all through Monday night and early on Tuesday morning, causing major parts of the city to be inundated. According to reports from Jamnagar district control room, the city recorded the maximum rainfall with 466 mm up till Tuesday morning. This apart, Khambhaliya recorded 208 mm rainfall, Jodiya 212 mm, Lalpur 164 mm, Kalyanpur, 155 mm and Bhanvad 85 mm rainfall. Mandvi, too, got its highest 24-hour rainfall of 449 mm.

Caught in an endless spiral of incessant rainfall, many localities of Jamnagar in Gujarat remained submerged after waters from the city's Lakota lake overflowed in the wake of heavy rains earlier in the day. Local residents were left struggling for survival after water flooded their homes and inundated roads while bringing normal life in the city to a virtual standstill.

Hundreds of people and vehicles remained stranded due to roads either being cut-off by the floodwaters or closed as a precautionary measure."The Lakota pond, which is located in the heart of Jamnagar, has overflowed because of the rains. We have diverted the overflowing waters to the regional river, due to which the inflow has been significantly reduced. The outflow of water is also being controlled by regulating the gateways," said P. Swarup, Commissioner of Jamnagar.

Thursday, July 22, 2010

In 12 hours, Kodinar gets 355.6mm rainfall

22 July 2010 - Times of India

Heavy to very heavy rains have been reported from all across Saurashtra, with Kodinar and Talala receiving maximum rainfall in the past 24 hours till Wednesday evening. While more heavy showers have been predicted in the next 72 hours.
According to the state meteorological department, Kodinar witnessed a cloud burst type of situation in which 355.6 mm of rainfall was reported. Similarly, Talala also experienced heavy rains at 254 mm of rainfall by Wednesday evening, bureau reports said.

"Flash floods were reported in Kodinar and Talala, where people living in low-lying areas were evacuated to safer places on a war-footing. Total rainfall of the season in Kodinar has now gone up to 680 mm. Areas like Viratnagar, government quarters and Ravi Complex in Kodinar were deluged with most of the shops remaining shut and people indoors. In Talala, Hiran river experienced a flash flood which swamped Tirupati Nagar area. A house in Tirupati Nagar was struck by lightning. However, no casualty was reported," said a district administrative official from Junagadh. However, no untoward report was received from any place in Junagadh.

Other talukas to receive major rainfall were Una, Visavadar and Sutrapada apart from Junagadh city. Schools and colleges in both Kodinar and Talala remained closed due to heavy rains. Following flash flood in Hiran river in Talala, water was flowing seven feet high on the bridge linking Sangodragir area, turning it into a virtual island disconnected from administrative help. Reports said, in Kodinar, two gates of Shingoda dam were opened after it started overflowing, while in Talala, 15 feet of water intake was reported in Kamleshwer dam.

Sunday, July 11, 2010

Widespread Rainfall across Tamilnadu in last 2 days

July 10, 2010 - The Hindu

Ramanathapuram

Several parts of Ramanathapuram districts received heavy rain on Friday, bringing cheer to the people. The rain, which began at around 10.30 a.m., continued till around 12 noon. The town received good rainfall for the first time since May. Rainwater logged the streets such as Vandikkara Street, Vevekanandar Street, Salai Street, Kenikarai, Agraharam Road and other low lying areas of the town. The sky was overcast all through the day in Ramanathapuram. Other areas including Paramakudi, a few places around Thiruvadanai received moderate to heavy rain. The rain had brought down the temperature to a great extent, which was abnormally high during the last few days. It was expected that the present climate would continue to prevail for a few more days.

Sivaganga

Many parts of Sivaganga districts including Karaikudi and Sivaganga also received heavy downpour on Friday. The people of Karaikudi enjoyed the heavy rain that lashed at the early hours. Many streets were flooded due to the heavy rainfall.

Salem

Rains for nearly two hours lashed Salem city and its suburbs on Thursday night inundating all low-lying areas. An unidentified body was found in a drainage channel on Friday morning at Seelanaickenpatti here. Rain water mixed with sewage entered the houses at many low-lying areas in the city forcing the residents to undergo a sleepless night on Thursday. As Corporation was undertaking desilting works in the channel at Narayanana Nagar, the entire water overflowed on to the streets causing great hardship to the residents who insisted that the works should be completed before the onset of rainy season. Sankagiri registered the maximum rainfall of 66 mm followed by Salem city - 55.5 mm, Yercaud - 55, Mettur - 54.8, Edapadi - 44 and Omalur - 19.8.

Krishnagiri

Heavy rain lashed many parts of the Krishangiri districts on Thursday night. Due to this, water level in many water bodies in the districts have improved moderately. Flood water entered residential colonies in low-lying areas near KRP Dam in Krishnagiri. Villagers of Chinnamuthur, Sundekuppam and Periyamuthur said that even a brief spell of rain, flood water logged in the area for two-three days. This is because of the absence of proper storm water drain facilities and encroachments on the canals, villagers said. The water level of the KRP Dam on Thursday was 48 ft against its full height of 52 ft. Depression brought rain in the district whole night on Thursday, from 8 p.m. to 4 a.m. Water levels rose in many water bodies in Denkanikottai, Thali area. The maximum rainfall registered in Thali is 107 mm. Rainfall in other areas in mm: Nedungal - 96.4, Shoolagiri - 86.4, Denkankottai - 86, KRP Dam - 75, Krishnagiri - 37.5, Anchetti - 25, Uthangarai - 33, Hosur - 14.4 and Royakottai - 14.

Dharmapuri

Due to heavy downpour in Dharmapuri, many roads such as Four Roads junction, Tirupattur Road, Mohamed Ali Road and Pennagaram Road were flooded. In many places, rain water was flowing on the road along with sewage. Rainfall registered in mm: Palacode - 114, Dharmapuri - 105, Marandaalli - 92.6, Thumbal Alli Dam - 57, Pennagaram - 44, Pambar - 40, Nagavathi - 33 and Chinnar Dam - 27.

Erode

Erode district witnessed moderate to heavy showers on Thursday night. Bhavani Sagar registered a maximum rainfall of 64 mm followed by Perundurai (30 mm). A few other parts in the district including Erode town, Bhavani, Gobichettipalayam and Sathyamangalam also received moderate showers on Thursday night.

Saturday, July 10, 2010

Rainfall characteristics of Coimbatore district in Tamilnadu

The Coimbatore district is situated in North Western part of the TamilNadu, the district covering an area of 4889 sq.km falls between 10°13'4" North to 11° 24'5" North latitude and 76° 39' 25" East to 77° 18' 26" East longitude. The temperature ranges between 18.32°C in the month of January and 36.42°C in the month of April. The area is bonded by Western Gates on West, Nilgiri hills in North West and Anaimalai and Palani hill in south. The district gradient of slope gradually decreases towards west to east, the district drain Bhavani, Noyal, Pallar, Amaravathi rivers. The study deals the rainfall characteristics of the Coimbatore District, which includes the spatial distribution and variability through different seasons, precipitation ratio and frequency occurrences. The study is based on 49 years of the monthly rainfall data for 33 rain gauge stations.

Winter Season

During the winter season the region heavily experiences low rainfall and it is driest among the all season which is maximum recorded at adjacent area of the region which Coonoor 86.82 mm in the month of February and lowest recorded at Coimbatore town which is 4.1mm in the month of February. The amount of rainfall decreases north west to north east and central part of region such as Annur, Sulur, Sultanpet, Krishnapurm and Podanur. Its rainfall average 20mm, this season contributes 2.07% to mean annual rainfall.

The variability rainfall is higher in this season while comparatively to other season, because low rainfall areas experiences greater fluctuation of variability. The lowest variability recorded adjacent area of region which is Coonoor 77.29% maximum at Palladam 232.2% and lowest variability recorded north western part which is Anaiktti 115.34% and southern part such as Upper Niradam (Chinnakallar), Solaiyar Nagar, Valaparai, Anaimalai experiences the low variability and central part eastern part gradually increase variability of rainfall, this fluctuations indicates the region experiences heavy low rainfall.

Summer Season

This is hot weather season the mount of rainfall gradually increases and however, the amount of rainfall occurrence in this season is largely due to convection effect, this season contributes 14.97% of mean annual rainfall this season average rainfall is 186.01mm and almost 80% area receives more than 186 mm accept north western and southern part of district. The highest amount of rainfall is recorded at the Upper Niradam (Chinnakallar) 224.14mm in the month of May and seasonal average is 370.7 mm and where the lowest rainfall is recorded in Krishnapuram 5.3mm and its seasonal average 69.8 mm.

The variability during this hot weather season maximum recorded at P.N. Palayam (86.36%), Attaikatti (79.93%), Negamam (78.34%), Sulur (77.86%), and Krishnapuram (76.07%) Coimbatore town (67.35%) Podanur (63.36%), Peelamedu (56.6%), and variability generally decreases from north to south and lowest variability experience adajecent area at Tthirumrthy Nagar 44.32%, and Solaiyar Nagar (49.07%), Sultanpet (52.03%), Vettaikarnpudur (54.93%), Mettupalayam (56.6%), and Pollchi (58.06%),.The variability of region highest experience in north and eastern part of region. This season will be low because west of influences by the pre monsoon winds.

South West Monsoon Season

Huge amount of rainfall variation noticed in this season, half of northern part of district receives low rain and half of southern part receives heaviest rainfall during season. The average rainfall of this season 573.20 mm and it is 46.13 % of mean annual rainfall. The highest seasonal rainfall recorded in Upper Niradam (Chinnakallar) (3655.5mm), and 1202.1 mm in the month of July, 996.25mm in June, 924.22 mm in August. Soliyar Nagar 2846.1mm, Anaimalais 2702.8mm, Valparai 2098.1mm, Topslip 772.4mm, lowest seasonal rainfall recorded in Krishnapurm 60.5mm, and 7.4 mm rainfall recorded in the month of August Sulur 113.9, Sultanpet 136.4 mm rainfall but southern parts of Districts receives more than 80% rainfall during this season. Most of south and west of Pollchi and Palaghat gap experiences highest rainfall, because of influence by leeward of Western Ghats. Upper Niradam, Soliyar Nagar, Anaimalais and Topslip are wettest places of district.

The south west monsoon rainfall variability experiences very less variability, comparatively to the other season, that is the 28.02% lowest at Topslip, Anaimalai, Valparai, Solaiyar Nagar and west of Pollachi and south of Chitrachavdi experiences very less variability due to heavy rainfall during this season. Where as very high variability experiences at adjacent area of region Poolankinar 89.99%, Sultanpet, Sulur, Krishnapurm, Podanur, and P.N.Palayam.

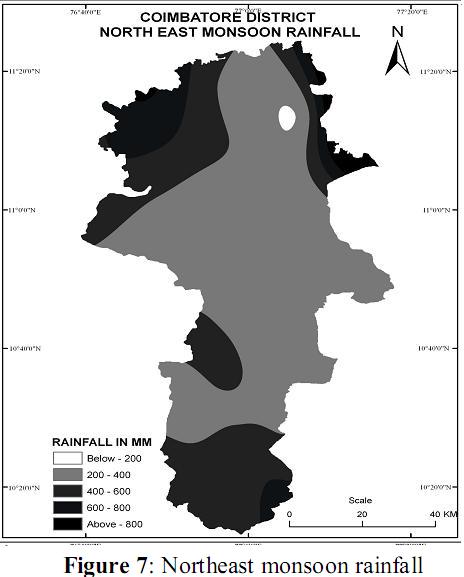
North East monsoon season

The North east monsoon season is important rainy season in the district, total rainfall in this season is low comparatively to the south west monsoon, but the eastern, north western, andcentral Upland region such as Annur, Sulur, Sultanpet, Negamam, Krishnapuram, Podanur Coimbatore town, and Peelamedu experiences maximum quantum of rainfall. This season contributes 36.82% of mean annual rainfall and average rainfall this season is 457.49 mm rainfall. The rainfall is gradually increase east to north west and south western part of the district, the highest rainfall recorded in adjacent area at Sundakapalayam 1713.3 mm, Upper Niradam 599.3, Anaikatty 589.64mm, Attakati 570.2, and where as lowest rainfall is recorded in Vettaikarnpdur 258.2mm, Annur 260.6mm and Krishnapuram 271.4mm, and Sultanpet 284.4mm, 80% of area receives well rain in this season, and most of agricultural activity takes places for showing crops.

The north east monsoon rainfall variability experiences higher than the south west monsoon due to lesser rain, the maximum variability recorded at adjacent area of such as Sundakaplayam 453.74% and lowest at Kethi 24.37% and north of Pollachi indicated higher variability and Anaimalai, Topslip, and Sultanpet experiences low rainfall variability. However rest of area experiences uniformity of variability.

Variability of Rainfall

“Variability defined as the deviation from mean” or “ratio of the standard deviation to the mean rainfall” and in other words variability of co-efficient of variation. Annual rainfall variability of region stretches between 19.69% to 387.91% at adjacent area of the region which is Coonoor and Sundakapalyam respectively, and 21.16% at Topslip and highest variability recorded in the central part of region that is Padanur (52.28%) and P.N.Palayam (51.81%) at northern part of region. Sultanpet experiences very low variability in eastern part district and in south western part Topslip and Vettaikarnpudur experiences low variability and Anaikatti, Coonoor experiences low variability in north western part of the region where as rest of district experiences homogenous variability in the region.

Coimbatore district bounded by Western Ghats,in the west and north of Nilagiri hills, in the south Anaimalai and Palani hills, and this district stretches in rain shadow region of Western Ghats. Normal rainfall of region during 1959­-2008 is 1242.49 mm and this district receives above normal rainfall of Tamil Nadu state. The maximum rainfall recorded at Upper Niradam (Chinnakallar) 1202.01mm in the month of July,and lowest of region recorded at Coimbatore town 4.1 mm in the month of February. The Coimabtore districts experiences driest in the month of January. The analysis of region heavy rainfall experiences towards the south and south western part and north western part in summer, south west monsoon and north east monsoon season, and huge amount of deficit in the east, north east and gradually in south east part and central part of district. The south west monsoon contributes the highest percentage of rainfall, which is 46.13% (573 mm), north east monsoon 36.82% (458 mm),summer 14.97% (186 mm) and winter season contribute lowest of which is 2.07 % (26 mm).

Source: Ishappa Muniyappa Rathod, Aruchamy.S, epartment of Geography, School of Geosciences,Bharathidasan University, Tiruchirappalli­.
Photo:-My Collections

Thursday, July 8, 2010

Ambala receives around 600 mm rainfall in three days

July 07, 2010 - The Hindu

Ambala, around 45 km from Chandigarh, has received around 600 mm rainfall in the last three days.

Ambala Rainfall
——————–
5th July – 174 mm
6th July – 191 mm
7th July – 197 mm

Major roads and rail tracks are flooded. Rivulets like Tangri near Ambala and Markanada were flowing above the danger mark. Few cracks have also appeared in the SYL canal in Kurukshetra where the water has crossed the danger mark and has entered many villages. "More enquiry counter to be opened at Ambala , the officer should show more maturity, " said Manish Tiwari , CPRO , Northern Railways.

Passengers in the Ambala Railway station are stranded as confusion still prevails as a result of the floods. "I have just arrived from Hissar, the train will start only by late evening. They may also cancel some trains, but what we expect is that at least they keep updating us about the trains services", said a stranded passenger. There was three to four feet of water at many places in Ambala, disrupting power supply and paralyzing normal life. Now the situation is under control,’ Ambala Deputy Commissioner S.P. Srow said.

Ambala, which is also a major army and air force base, remained under one to two feet of water. ‘No one from the administration is helping us. We don’t even have drinking water. All our household things have been damaged by water,’ said Savitri Devi, a resident of Ambala.

Friday, July 2, 2010

Rainfall characteristics of Nilgris in Tamilnadu

South West Monsoon

Greater part of the total annual rainfall (88 cm out of 170 cm) is brought by the south-west monsoon which blows from June to September and the heaviest falls occur in the stations of the which are furthest west and thus are the first to receive this monsoon. As it travels eastwards the current rapidly deposits the moisture with which it is laden and every succeeding station to the east gets less and less rain from it. Thus at Devala which is just at the top of the Western Ghats and receives the full force of the monsoon straight from the sea and the total annual rainfall is nearly 411 cm against the district average of 170 cm and of which rainfall during the south-west monsoon is 336 cm against the district average for that period of 88 cm. Gudalur is much sheltered from the south-west by the spurs on the northern boundary of the Ouchterlony Valley and there the annual rainfall drops to 229 cm of which nearly 177 cm are received during the south-west monsoon. But at Naduvattam which is above these spurs and on the very crest of the plateau and so just at the spot where the monsoon receives a sudden check in its progress the total rainfall rises again to nearly 258 cm of which 201 cm come with the south-west monsoon.

As the monsoon travels eastwards across the plateau it gives less and less rain. The fall during its course at Paikara (only four miles east of Naduvattam as the crow flies) drops to 131 cm, at Ooty (eight miles again east) to 57 cm and at Coonoor which is sheltered by the big spurs of the Dodabetta range to only 40 cm. This Dodabetta range checks the current and causes it to deposit the greater part of the moisture which it has left and all north east the recording stations to the east of it (Coonoor, Wellington, Kothagiri and Kodanad) receive less rain from it than they do from the north-east monsoon which blows in the directly opposite direction from October to December.

North East Monsoon

During the NE monsoon the above conditions are all reversed and the stations on the east of the district fare better than those on the west for the same reason as before namely that this monsoon reaches them first before it has deposited much of its moisture. At Coonoor which stands at the head of a ravine the mouth of which faces east and so collects the damp winds like a funnel the fall between October and December is as high as 78 cm. Wellington, which lies further within the plateau and is somewhat sheltered by the hills to the east of it receives only 54 cm. Kothagiri and Kodanad which are on the eastern crest of the plateau get 71 and 62 cm respectively and Kilkundah, where the rain driving up the Bhavani valley is checked receives 57 cm. But at Ooty which lies right under the protecting mass of Dodabetta, the fall during this monsoon is only 37 cm at Naduvattam, farther west only 32 cm and at Gudalur, down under the lee of the plateau only 27 cm.

Between January and March its the driest season of the year Coonoor, the other stations on the east of the district and Kilkundah all receive some benefit from the last showers of this north-east monsoon; but nowhere else is the fall in these three months as much as 5 cm. In April and May showers appear impartially all over the country and every station gets from 18-26 cm.

This unequal distribution of the rainfall, as is pointed out elsewhere in this book is of the greatest importance from an agricultural point of view plants and trees which will do well on the moisture west side refusing to flourish on the drier eastern slopes and also provides the resident in the district with a wide choice of climates. Its greatest extremes do not appear in the official statistics, for there are no recording stations in either the wettest or the driest parts of the district. Probably the annual rainfall on parts of the Kundahs is as much as 508 cm and that on the south eastern slopes above the Coimbatore district as little as 102 cm. The average annual fall in the district as a whole is raised by the heavy rain in its western stations and is thus larger than in any other collectorate except the two on the west Coast proper Malabar and South Canara.

In Ooty itself the total rainfall is only 123 cm which is less than that of Chennai 125 cm and very little more than the figures for the littoral districts (Chengelpet 115 cm, South Arcot 111 cm and Tanjore 114 cm) . Yet Ooty is popularly classed as a rainy spot. The chief reason for this is the fact that nearly two-fifths of its total fall is received during the three months (May — July) during which it is full of visitors and that this arrives in lighter showers than anywhere else in the district and is spread on an average of over 38 of the 92 days in those three months. A visitor who finds that more or less rain has fallen on 40 per cent of the days he has spent in the station and classes the place as damp locality.

Source: W. Francis, Asian Educational Services
Photo:-My Collections

Thursday, July 1, 2010

Chennai: One of the coolest June in decades

July 01, 2010 - Times Of India

If you enjoyed the weather more this June, you had good reason to feel as if spring was in the air. It was the third coolest June in 42 years with the mercury dipping below the average for 14 days in the month, said Met officials. “This June, the average fell from 37 to 35.2 degrees Celsius. In 1991, it was 34.3 degrees and 34.9 degrees in 1996,” said YEA Raj, deputy director general, regional meteorological centre. Since 2005, the monthly average has been higher. With the onset of the southwest monsoon, local thunder storm activity brought in a good amount of rainfall to the city. Met officials said the arrival of cyclone Laila and the rainfall in the wake of its withdrawal was the beginning of a good run on the weather front. The city enjoyed nine days of rainfall of varying degrees this June. Although nowhere near the record 698 mm seen in 1996, Nungambakkam registered 137 mm and Meenambakkam 130. The city’s normal is around 40 mm for June, added Raj. In 1991, the city received 264 mm in June.

The thunderstorm activity was not restricted to the city alone, with all but three districts receiving excess rainfall. Against the normal of 42.1 mm, the state received 78.5 mm, an 87% excess. “The last month has been exceedingly good for the state. The trend is likely to continue in July as well, and we can expect more rains and cooler days,” added Raj.

Sunday, June 20, 2010

Rainfall characteristics of Kerala

The south-west monsoon current, which brings in most of the annual rainfall to Kerala, gets a forced ascent at the Ghats and the windward slopes experience very heavy rainfall. However, rainfall is not uniformly distributed on the windward slopes and there are pockets of very heavy rainfall and relatively less rainfall. The coastal region of the state also receives abundant rainfall. The results suggest that Kerala can be divided into three unique rainfall regions, each region having a similar covariance structure of annual rainfall. Stations north of 10.N (north Kerala) fall into one group and they receive more rainfall than stations south of 10.N (south Kerala). Group I stations (table 2) receive more than 65% of the annual rainfall during the south-west monsoon period, whereas stations falling in Group II (table 3) receive 25-30% of annual rainfall during the pre-monsoon and the north-east monsoon periods. Group III stations (table 4) with IIIrd factor as the primary loading, i.e., IIIrd factor greater than Ist and IInd factor. The meteorology of Kerala is profoundly influenced by its orographical features, however it is difficult to make out a direct relationship between elevation and rainfall. Local features of the state as reflected in the rainfall distribution are also clearly brought out by the study. The classification of Kerala according to the important factors is given in figure 2.

Group I stations - 75% of the annual rainfall from South West Monsoon

There are 28 rainfall stations in Group I, which can be again classified into 2 according to the contribution of south-west monsoon rainfall (see regions Ia and Ib in figure 2): Stations receiving more than 75% of the annual rainfall during the south-west monsoon, and stations receiving 65-75% of the annual rainfall during the south-west monsoon season. All these stations are situated north of 10.N (north Kerala) and receive more rainfall than stations south of 10.N (south Kerala). This division into north and south Kerala arises from the fact that monsoon rainfall progresses from south to north along the west coast of India and there are differences in the rainfall characteristics between the southern and northern parts of the state. An examination of the monthly rainfall pattern shows that rainfall is highest in June south of 10.N while north Kerala experiences the highest rainfall in July. With each surge in the monsoon current,rainfall is more in north Kerala than in the south and the frequency of surges is higher in July than in June. The active spells of monsoon are also more in July and August. Further, under weak monsoon conditions there is divergence over south Kerala causing little or no rain, while there is convergence resulting in rain over north Kerala on many occasions.

Group II stations - 30% of annual rainfall during pre-monsoon and north east monsoon

South Kerala stations have the second factor as the primary factor and there are 26 stations in Group II. All these stations receive 25-30% of the annual rainfall during the pre-monsoon and north east monsoon season. (i) Precipitation during pre-monsoon is mainly from thundershowers and there is an increased thunderstorm activity in the southern tip of Kerala state from March onwards increasing progressively with the advance of the season. May makes the maximum contribution to the rainfall of the pre-monsoon period (March - May). The south-west monsoon advances over south Kerala between 11th and 31st May in nearly 50% of the years, and this is a contributory factor for the pronounced rainfall maximum over south Kerala during this season.

(ii) Most of the rainfall during north-east monsoon is closely associated with the westward passage of storms and depressions, which are remnants of low pressure systems that move into the Bay of Bengal. The tapering shape of the peninsula and the lower elevation of the Western Ghats in the south are the main reasons for rainfall during this season in south Kerala.

Group III stations - Orographic rainfall, Localized terrain & leeward slope of the Ghats

The meteorology of Kerala is profoundly influenced by its orography. This is reflected as the third factor in the factor analysis. Of the 77 stations, 23 stations have this factor as the primary loading. Even though these stations have the third factor as their primary loading, all these stations do not have the same rainfall pattern and can be classified into three groups. (i) There are 8 stations that receive very heavy annual rainfall (> than 336 cm) and are located on the windward slope of the Ghats. On the windward side of mountains, moist air is forced up the slope, where it cools and condenses, leading to precipitation. These peaks also provide convection points of instability. This instability will be triggered when the orographic lifting is strong enough to force air parcels to ascend to their level of free convection. Thus, the heavy rainfall over the windward slopes depends not only on the elevation of the station but also on the wind velocity perpendicular to the mountain range and on the moist static stability.

(ii) There is a second group of stations that receive normal annual rainfall and has the third factor as their primary loading factor. The local features of the stations are also significant in this factor. For example Punalur a station in south Kerala is surrounded by rocky terrain on its four sides and this station experiences very high thunderstorm activity.

(iii) Stations that lie on the leeward slope of the Ghats and stations situated in the Palghat Gap receive very less mean annual rainfall (less than 224 cm) and load primarily on the third factor. Air flowing across a mountain range will be forced upwards, and therefore it cools and produces local precipitation. When the air reaches the other side of the range, it's been effectively "wrung out" and tends to be dry. This produces a "rain shadow" effect on the lee side of mountains (the side away from the wind direction) where it tends to be dry.

The complex relationship between topography and precipitation in mountainous regions is evident in the pattern of rainfall distribution. A frequency table showing the rainfall and elevation is illustrated in table 5. Stations are classified according to their elevation into 5 groups. The normal rainfall of Kerala for the period of study is 280 cm and stations having rainfall greater than 20% of the state normal (i.e., greater than 336 cm) are classified as excess rainfall stations and those having rainfall less than 20% of the state normal (i.e., less than 224 cm) are grouped as scanty rainfall stations. It can be seen from table 5 that while there are 4 excess rainfall stations with elevation between 500m and 1000m 3 stations with the same altitude experiences only scanty rainfall. Figure 3 illustrates the rainfall versus the elevation of each station. It is evident from the figure that it is difficult to make out a direct relationship between elevation and rainfall. The spatial variability of mean annual precipitation depends upon the topographic factors like exposure of the station to the prevailing wind, elevation, orientation, and slope of the mountain.

Source: Anu Simon and K Mohankumar, Department of Atmospheric Sciences, Cochin University of Science and Technology, India

Photo:-My Collections

Rainfall data from 1-Jan-2010 to 19-Jun-2010

India toppers from 1.1.10 to 19.6.10
-----------------———————————–—————
Cherrapunji (Meghalaya) - 681 cm
Passighat (Arunachal Pradesh) - 207 cm
Silchar (Assam) - 204 cm
North Lakhimpur (Assam) - 165 cm
Gangtok (Sikkim) - 152 cm
Itanagar (Arunachal Pradesh) - 150 cm
Dhubri (Assam) - 148 cm
Dibrugarh (Assam) - 142 cm
Vadakara (Kerala) 134 cm
Piravom (Kerala) – 130 cm
Coochbehar (West engal) - 124 cm
Lengpui (Mizoram) - 115 cm
Guwahati (Assam) - 113 cm
Kottayam (Kerala) - 110 cm
Kochi (Kerala) - 108 cm
Agartala (Tripura) - 107 cm
Tezpur (Assam) - 106 cm
Jalpaiguri (West Bengal) - 105 cm
Subramanya (Karnataka) - 105 cm
Kozhikode (Kerala) - 103 cm


Tamil Nadu toppers from 1.1.10 to 19.6.10
-----------------——————————————————
Valparai (Coimbatore dt) – 87 cm
Chinna Kallar (Coimbatore dt) - 77 cm
Pechiparai (Kanyakumari dt) – 72 cm
Devala (Nilgiris dt) – 69 cm
Kuzhithurai (Kanyakumari dt) – 58 cm
Kodaikanal (Dindigul dt) – 45 cm
Thuckalay (Kanyakumari dt) – 43 cm
Thalli (Krishnagiri dt) – 43 cm
Boothapandi (Kanyakumari dt) – 38 cm
Gudalur Bazaar (Nilgiris dt) - 38 cm
Ketti (Nilgiris dt) – 36 cm

Friday, May 21, 2010

Cyclone Laila batters Andhra - Addanki receives 522 mm & Maddipadu 510 mm

Andhra Pradesh heaved a sigh of relief after cyclone Laila weakened ahead of landfall about 30 km from Bapatla in Guntur district on Thursday afternoon but still left 16 people dead, flooded thousands of homes, snapped power supply in many areas and threw rail and road traffic out of gear in the coastal region of the state.

The cyclone hit the coast near Bapatla around 1.40 pm and moved on northwards by 5.30 pm. "The system is likely to weaken gradually and move initially in a northerly direction and then recurve in northeasterly direction towards south Orissa. There is a possibility of the cyclonic system emerging in the north Bay of Bengal and intensifying again over sea," the Indian Meteorological department warned and called for vigil across the region for at least another 24 hours. Despite the cyclonic system moving away, the coastal region of AP is expected to receive heavy to very heavy rains on Friday as well.

The swollen Addavagu at Madhiralapadu surging with flood waters in Ongole after Cyclone Laila hit. Photo: Srinivas Kommuri
The swollen Addavagu at Madhiralapadu surging with flood waters in Ongole after Cyclone Laila hit.

Even as the cyclone-battered Ongole town is limping back to normality, the heavy rain received in the last two days, has made rivulets like Gundlakamma, Addavagu, Pothurajukalva swollen.

Addanki received the highest rainfall of 522 mm followed by Maddipadu 510 mm and Kothapatnam 258 mm in the last 24 hours. Ongole has got 320 mm on May 20th and 142 mm in last 24 hours. Three irrigation tanks suffered breaches People in several villages like Maddiralapadu, Chevella, Karavadi, Gundayapalem, Chintala were marooned on Friday.

Sunday, May 16, 2010

Rainfall on the Meghalaya plateau in Northeastern India

Monthly and daily variations in rainfall over Cherapunjee and Mawsynram on the Meghalaya plateau of northeastern India are analysed. Cherapunjee and Mawsynram are well known as two of the places with the heaviest rainfall in the world. The daily rainfall variation is attributed to the influence of synoptic scale disturbances, with a periodicity of 10–20 days, and the orographic interaction. The annual and monthly highest rainfalls over Cherapunjee during the 31 years from 1973 to 2003 were much larger than mean values.

The Meghalaya plateau is located on the northeastern part of the Indian subcontinent and consists of relatively high hills. The highest hill peak of the region is about 1,965 m above mean sea level (Fig. 1). Meghalaya means ‘‘adobe of clouds’’. Cherapunjee is well known as the place with the world record for the highest rainfall of 26,461 mm, during August 1860 to July 1861. It is located on the southern slope of the Meghalaya plateau and inside a deep canyon with steep cliffs. Four seasons are experienced in Cherapunjee, viz., winter (December–February),pre-monsoon (March–May), monsoon (June–September) and post-monsoon (October–November). It was opined that Mawsynram might be the rainiest station in India. Mawsynram is the neighbouring village of Cherapunjee, and a rain gauge was installed in 1941 and hence the mean annual rainfall over Mawsynram and Cherrapunjee was compared simultaneously for 10 years and the annual mean rainfall over Mawsynram was larger than that over Cherrapunjee. However, they indicated the difficulty of this comparison, because of the limited data of 10 years. The rainfall records for Cherrapunjee and Mawsynram are available for 100 and 60 years, respectively. After comparison of annual mean rainfall over both stations, Cherrapunjee still has the maximum rainfall over 24 hours, 1,036.3 mm in 1867, in India. On the basis of hourly rainfall analyses for 4 years, indicated that rainfall over Cherrapunjee occurred mostly in the early morning (0100–0700 IST). It was speculated the existence of the frontal zone with dry easterly or northerly to the north and maritime wet southerly to the south to explain the morning rainfall and the effect of topography along with the front near Cherrapunjee caused the extraordinary rainfall. Recently, observations using the tipping-bucket rain gauge revealed that severe hourly rainfall occurred during the night.

Analyzing the variations in annual, monthly and daily rainfall over Cherrapunjee was done, Cherrapunjee is located on the southern slope of the Meghalaya plateau, most of the rain flows directly down into Bangladesh; the amount of rain falling in the catchment area upstream of rivers is important for the forecast of severe floods in Bangladesh. By comparing the rainfall over Cherrapunjee and the water level in adjoining rivers in Bangladesh, The water level in Bangladeshi rivers is significantly related to rainfall over Cherrapunjee.

By utilizing the monthly rainfall data from January 1973 to December 2003 and daily rainfall data from June 2003 to July 2004, supplied by IMD. Figure 2 shows the annual rainfall variation at Cherrapunjee for 31 years from 1973 to 2003. The maximum rainfall was 24,555.3 mm in 1974 and the minimum was 6,950.3 mm in 1978. The average annual rainfall during this period (referred to as l) was 11,987 mm with a standard deviation (referred to as r) of 3,324 mm. Most of the rainfall occurs during the summer monsoon season, and the amount of rain in winter is much less. Rainfall begins to increase in March, with 300 mm, and the rainy season continues until October. The peak of monthly rainfall comes around July, at more than 3,000 mm. The variation of monthly rainfall during 1974 (the year of highest annual rainfall) is shown as a dashed line. The monthly highest rainfalls during the 31 years under consideration were recorded in the 4 months of April, July, September and October in that year.

Source:Fumie Murata, Taiichi Hayashi, Jun Matsumoto & Haruhisa Asada for Nat Hazards (2007)
Photo:-My Collections

Saturday, May 15, 2010

Will there be a cyclone?? Will it cross Chennai around 21st May 2010

The US Centres for Environmental Prediction (NCEP), too, shows southwest Sri Lanka being hit during the week ending May 21. The NCEP has gone on to signal heavy precipitation over the Tamil Nadu coast and over the north-eastern States concurrently during May 21 to 28.

Meanwhile, the CPC points towards the possibility of enhanced convective phase of the Madden-Julian Oscillation (MJO) wave and numerical weather forecast guidance forcing tropical storm formation for the Arabian Sea during next week. The CPC outlook also said that the active MJO phase would trigger enhanced rainfall for the eastern Indian Ocean and the maritime continent during this phase as well as the southern tip of Sri Lanka. Interestingly, it sees possible tropical storm spinning up over the southwest Bay of Bengal thereafter.

This is exactly the scenario being envisioned by Prof Paul Roundy, a leading US-based ocean weather forecaster, to unfold around May 25.

The European Centre for Medium-Range Weather Forecasting (ECMWF) has predicted that the South-West monsoon may hit Sri Lanka around May 20, a week before schedule.

Source:Business Line
Photo:-My Collections

Friday, May 14, 2010

Wettest places in India


By incorporating data from unofficial, non-reporting raingauge stations a list of locations with an average annual rainfall exceeding 5000 mm can be compiled for India. All stations are located along the westward exposed escarpment of the Western
Ghats at a distance of not more than 100 km from the Arabian Sea. Here the superimposition of la~'ge-scale dynamic and static, locational "controls" during the Southwest Monsoon period (June-September) results in annual, monthly and daily rainfall amounts that are only surpassed at a few stations outside the peninsula in Northeast India. The fourteen rainfall stations (see Fig. 1) whose mean annual rainfall is 500 cm (i.e. 200 inches) or more.Among these fourteen stations, there are only two stations (viz. Cherrapunji and Mawsynram) whose mean annual rainfall is more than 1100 cm. These fourteen stations have been called the rainiest stations of this country.

In addition to the heavy rainfall stations listed 7 other locations(with a minimum of 10 and up to 39 years' continuous records) were found to receive over 5000 mm of rain per year on an average. However the figures are not strictly comparable since they do not relate to identical observation periods; nevertheless, they indicate those areas in Peninsular India where rainfall of such quantity and intensity can be expected.

The most conspicuous feature regarding the spatial distribution of the 17 heavy rainfall stations in Peninsular India (Fig. 1) is their alignment along the westward exposed slopes of the Western Ghats (or Sahyadri Range) within a distance of not more than 100 km from the Arabian Sea and in close proximity to the (asymmetric) subcontinental "divide" or watershed which runs parallel to the west coast of the peninsula. While 9 stations are located at the western edge of the Deccan in Maharashtra and Karnataka, the remaining stations represent heavy rainfall areas in the "mountain blocks" of 'Tamil Nadu and Kerala further south: 4 in the Nilgiris, the junction of the Western and Eastern Ghats culminating in Dodabetta (2636 m), 3 in the High Range (or Kanan Devan Hills) next to Anaimudi (with 2695 m the highest peak in India south of the Himalayas) and finally Peermade in the Cardamom Hills, about 75 km from the Kerala coast.

Another characteristic of all stations falling into the "heavy rainfall" category as defined above is revealed by studying their annual rainfall pattern: a long dry season from November to April/May in the north and from December to March/April in the south, i. e. during the Northeast Monsoon period when "tropical easterlies" (or "trade winds") with large-scale subsidence and stability in the lower and middle troposphere prevail and when depression or cyclonic influences hardly ever reach these tracts of India. Rainfall during the dry season constitutes less than 5% of annual precipitation. At Mahabaleshwar, for instance, the average from November through April, for half the year, just reaches 100 mm and accounts for only 1.5% of the annual total.

Thus precipitation in the heavy rainfall areas in Peninsular india is mainly based on rainfall during a comparatively short rainy season. This "seasonal concentration" is the result of dynamic (weather) "controls" and locational factors interacting during the course of the annual monsoonal rhythm, the alternation of dry weather conditions during the Northeast Monsoon and the "rain-producing" synoptic patterns during the Southwest Monsoon.

Source:H. J. von Lengerke, South Asia Institute, University of Heidelberg, Germany
Photo:-My Collections

Monday, May 10, 2010

Rainfall variation in Windward Vs Leeward sides of the Cardamom Hills (Western Ghats)

The data from Elappara (Windward side) and Bodinayakkanur (Leeward side) were used in this study. The first is instrumental data from the Elappara during 110 years (1896-2005), representing high altitude humid tropics in the Elappara range of cardamom hills (part of Periyar basin in Kerala facing the Arabian Sea). The station is one of the few hill stations in southern India, which has a record of more than 110 years of rainfall data. The station is located in high altitude (1500 msl) mixed tropical forest, which is a major type of forest in Western Ghats, where there is no clear seasonality in environmental factors such as rainfall and temperature. The other data set is from the Bodinayakkanur station located in Tamil Nadu, on the eastern slopes of the cardamom hills facing the Bay of Bengal (falling under semi-arid tropics) and provided 100 years of rainfall data (1906-2005). This rain gauge station is attached with TWAD (Tamilnadu Water and Drainage Board) board, Bodinayakkanur, Tamil Nadu. The Elappara range forms the western boundary of the cardamom hills' reserves (CHR). The Bodinayakanur range forms the eastern boundary of CHR in Tamil Nadu. The Chokkanadu and Kolukku Malai form the northern boundary. To the west of Elappara range, tropical rainy climate prevails. As one moves eastwards, the climate gets more arid, till it is regarded as completely arid in the region between Saptur and Usilampetti ranges. The CHR thus constitutes an area of 334 square miles, with Bodinayakanur and the Elappara are the representative stations for the two extreme ecosystems the humid and semi-arid tropics (Fig 1) respectively.

LEEWARD SIDE

Semi-arid slopes and the plains of Bodinayakkanur are characterized by a high temporal variability of seasonal and annual rainfall. The data show a drastic change in the rainfall pattern from seasonal to decadal scales (Fig 2), but no significant periodicity appears to be present. Over the last hundred years, the contributions of the ISM, NEM and BR (Blossom Rainfall) were 21.3%, 48.1% and 30.6% respectively. The highest rainfall of 2270.4mm was recorded in the year 1958 and the lowest rainfall of 328.5mm was reported in 1983. Mean annual rainfall for entire period was 767.1mm with a coefficient of variation (CV) of 36.9% and standard deviation of 282.8mm. Highest CV was reported for ISM (108.6%) followed by BR (44.30%) and NEM (40.3%). ISM rainfall ranged from19.82 to 1327.8mm while NEM rainfall varied from 83.8 to 773.3mm. BR also varied greatly from 32.9 to 665.4mm. Since CV was higher than 30% for all the seasons, the region experienced more frequent and severe droughts during the period. Higher Precipitation Concentration Index (PCI) (>20) was recorded only in the recent past three decades, which implies very long dry periods for up to 3-5 months. The PCI denotes uniformity of monthly distribution in a year over a particular station or the inter-annual variability. Therefore year-to-year variation in rainfall was considerable and showed definite decreasing trend during the last three decades. The index value was always below 20 for the previous decades.

The mean rainfall of the recent past three decades was well below the centennial average rainfall, clearly indicating decreased monsoon activity. This could be related to increase in tropical deforestation and land use change occurring in the areas surrounding this semi-arid ecosystem, like the Montane cloud forest high waives (Mehamalai) and the cardamom hills during the report period. No alternating pattern of increasing and decreasing rainfall in the decades is seen and no epochal trends in ISM as observed for the rest of the country. The 20, 30, 40 and 50 year running means showed declining trends (2.7 to -3.4 mm per year, with R2 values ranging from 0.42 to 0.85, significant at 95%). This means the future rainfall in the rain shadow slopes of the cardamom hills is likely to decrease. Though historical records say that the eastern slopes have enjoyed good rainfall, in the last century the slopes had lost their thick evergreen forest (90% of primary forest). Whether this has triggered or will trigger changes in rainfall pattern, questionable and sensitivity analysis performed elsewhere showed some teleconnected effects of deforestation in the precipitation change of south East Asia. El Nino and La Nina events have profound influence on the rainfall of this region. The most intense El Nino year in the last century was 1997, when the rainfall was well above the average. Nearly 58% of the El Nino years had below average rainfall. On the other hand 42% of the El Nino years accounted above normal rainfall. Amazingly the lowest rainfall of the last century was in 1983(328.5mm), which happened to be a typical La Nina year, and the effect was spectacular. 70% of the 17 La Nina years brought about below average rainfall and only 30% of the La Nina years experienced more than average rainfall. This shows a changing relationship between semi-arid rainfall climatology and ENSO in this region. Up to many decades ago, the entire area was under cardamom cultivation. For the past 8-10 years, the actual area under cardamom cultivation has shrunk to about 40,000 hectares. Relatively drought resistant crops like coffee and silk cotton are cultivated in the remaining areas. This is indicate the insufficiency of rainfall on the eastern and northern borders of CHR, and the severity of aridity is advancing towards up in the cardamom hills' reserves into the state of Kerala.

WINDWARD SIDE

In our analysis for the period (1896-2005) (Fig 4) the highest rainfall of 7000 mm (1961) was reported. This could be the second highest rainfall in the leeward hill slope of south-Western Ghats in peninsular India after Shimoga in Karnataka where in 8000 mm in a year was received. Careful study of the long term climate record has shown that even seemingly modest fluctuations in rainfall can create havoc in vulnerable societies. Orographic lifting favors the windward to the leeward side ofmountains for convection. However, a close examination of other gauge stations data of the cardamom hills (10-20 years data) indicate that the constant high rainfall (>5000mm in a year) is received near Anaimudi peak (2694 msl). The putative reason for the rainfall maximum in these mountains could be attributed to the strong convection, which undergoes diurnal cycle in which these mesoscale mountains play important role. However, the studies on the reasons for local rainfall maximum need careful observation and analysis besides understanding the physics behind convection-circulation interaction in the mesoscale mountains. The inter annual variations in the monthly rainfall values are very large; for example the values for January and February changed by as much as a factor of two or more from one year to another. The lowest rainfall during the period was reported in 1987 which was one of the two most intense El-Nino years in the world.

There was a strong association of El-Nino phenomenon with below average rainfall (67% of the El-Nino years), indicating a good ENSO relationship. In the case of La-Nina years, fifty per cent of the years enjoyed excess rainfall and rest of the years were low rainfall years. However, the impact of El-Nino phenomenon was not severe during the first pentad of this century in this mountain range. This shows the relationship seems to have weakened in the recent past. Considering these, the scientists concerned should take precautions in forecasting local climate. The coefficient variation of rainfall (CV) for the entire series ranged from 9 to 27%. The decadal averages for the first three decades (1896-1925) and the last three decades (1976-2005) studied, reported values less than the annual mean (5000 mm) for the whole period (1896-2005). Only during the middle period (1926-1975), the decadal average rainfall did exceed the series annual mean. Interestingly the strongest El-Nino years (1997-1998) had received (5120 mm) fairly well above the annual mean. Since 1896, of the total El Nino years, only ten years each in El-Nino and La-Nina years had envisaged less than average. Otherwise all other El-Nino and La-Nina years found to be more than the annual average (5000 mm). These results are found to be for and contradictory to the results reported for many regions of varied environment in India Therefore, extreme rainfall anomaly can occur even in the absence of strong ENSO events, thus uncertainty in ENSO effects is quite large from one environment to another even that are close to each other. The production trend of major spices and plantation crops shows a negative trend for the first one and half a pentads (2000-2007) of this century. Cardamom reported a maximum percentage change of -12.5.1% followed by black pepper (-10.0%) in CHR. In particular, tea production in the cardamom hills has gone down significantly reporting a percentage change of -20% during the recent past seven years. Therefore, this unhealthy trend of production of specific crops is certainly due to the change in the climatic condition which affects both quantity and quality of crops.

Though at this point in time the cardamom hills receive more rainfall than the crops require (for the successful production of tea and cardamom), in the near future the cardamom and tea ecosystem hydrology may get affected as the demand for water is expected to raise many fold. Already many stream flows have been found to decrease and become short lived. Thereby, the ecosystem degradation could be more pronounced at than the present level because cardamom is very sensitive to drought conditions. The most semiarid eastern slopes of the cardamom hills are experiencing down ward march of rainfall. Under the decreasing rainfall pattern coupled with continuing atmospheric warming scenario, the near future could jeopardize the agriculture and sustainable development in this resource (water) poor semi-arid ecosystem, and the coming years could be highly challenging to climate and agriculture scientists as the demand for water would increase by 20-80% in this densely populated valley. Already half a million people from the eastern slopes have moved to western slopes in search of livelihood and the eastern slopes now look like a desert, with at least100 sq.km area (Thevaram- Bodi tract)which have been rendered into a desert like system. Immense ecological degradation and dangerous climatic variability of cardamom agriculture has already been an immutable truth elsewhere in the world. Therefore, understanding rainfall variability in these limited ecosystems is important.

Source:M.Murugan, V.Mukund, R.Ramesh, M.B.Hiremath, A.Josephraj kumar and P.K.Shetty for Caspian Journal of Environmental Sciences, University of Guilan, Iran
Photo:-My Collections

Saturday, May 8, 2010

Rainfall around Bhavani River basin

The Bhavani and Moyar rivers flow together into the Bhavanisagar reservoir after which it becomes the Bhavani River (Fig. 1). The Bhavani River is a tributary of the Cauvery, one of the largest rivers in India. This study refers to the combined catchment area of the Bhavani and Moyar rivers, which are referred to as the Upper Bhavani river basin. The basin (4100 km2) is a high altitude area at the confluence of the Eastern and Western Ghats, bounded to the north by the state of Karnataka,to the west by Kerala to the east by the Bhavanisagar reservoir and to the south by the Coimbatore plateau. The elevation of the river basin ranges from 300 m a.m.s.l. on the plains to 2600 ma.m.s.l. on the Nilgris plateau. Accordingly, the annual rainfall varies from 700 mm on the lowlands to nearly 3000 mm in the hills. The topography is undulating in the lower plateau and uplands while rugged in western parts. The vegetation coverage is a mosaic of grassland, deciduous and coniferous mountainous forests, plantation and agricultural crops.

The main part of the basin has a humid equatorial environment, although the lowland plains are sub-humid. The weather is dry from January to May whereas heavy rains are common during the southwest (SW) monsoon (June-September), and the northeast (NE) monsoon (October-December). The SW-monsoon dominates in the western part of the river basin while the NE-monsoon prevails in the eastern region, due to the hills running in a north-south direction which act as a barrier to both monsoons. Both the western and eastern areas can therefore be regarded as rain shadow areas during one of the monsoon periods.


Source:Julie Wilk & Lotta Andersson,Department of Water and Environmental Studies, Linkôping University,Sweden

Photo:-My Collections

Wednesday, May 5, 2010

Northeast Monsoon in Tamilnadu

Tamil Nadu, located in southeast Peninsular India receives the major part of its annual rainfall during the northeast monsoon(NEM) season (the three-month period from October to December). While coastal Tamil Nadu receives about 60% of its annual rainfall, interior Tamil Nadu receives about 40–50% of annual rainfall during NEM season (IMD 1973). In comparison with Indian Summer Monsoon (ISM), the NEM is characterized by limited aerial extent and average lesser rainfall amount. During NEM season, Tamil Nadu generally receives rainfall due to the formation of trough of low, cyclonic circulation, easterly waves, low pressure area, depression and cyclonic storm over Bay of Bengal. Because the NE monsoon season is the major rainy season, the vicissitudes of the rainfall of Tamil Nadu state has led to considerable and widespread interest among the public/farmers and in government circles in recent years, in view of the frequent failure of northeast monsoon rainfall (NEMR) over Tamil Nadu and the consequent water scarcity condition.

The NEMR series of Tamil Nadu during 1901–2004 was prepared as follows: The daily rainfall data of 173 stations in Tamil Nadu for the period 1901–1996 was obtained from National Data Center, Pune. Using this daily data, the seasonal rainfall series of Tamil Nadu subdivision for the period 1901–1996 was constructed. The data for the remaining part of the series was collected from the weekly weather report of Area Cyclone Warning Centre, Chennai (Tamil Nadu). As per IMD criteria, excess (deficient) monsoon years for subdivision is defined as whenever the percentage departure of seasonal rainfall from normal of subdivision is more (less) than +19% (−19%). Using this criteria, the excess and deficient NE monsoon years during the period 1901–2004 were identified. During this period there are 22 excess NE monsoon years and 25 deficient NE monsoon years and these are listed below.


Tamil Nadu receives mean rainfall of about 450mm with coefficient of variation 28% during NEMR season. Figure shows the mean rainfall distribution over Tamil Nadu during NEMR season. During the entire NEM season, northeast coastal Tamil Nadu receives rainfall exceeding 600mm. Generally rainfall decreases westwards from coastal area to inland and from north to south. Figure shows the NEMR of Tamil Nadu during the period 1901–2004 expressed as percentage departure from long term normal. Out of 104 years of present study, NEMR over Tamil Nadu was below normal for 54 years (i.e., about 53%). The NEMR over Tamil Nadu was continuously below(above)long term average for a maximum of 9(4) years. Ropelewski and Halpert (1987) found that NEMR over south Tamil Nadu is enhanced (diminished) during the well-known El-Ni˜no episodes that refer to the events of warming (cooling) over central and equatorial Pacific Ocean. Out of 24 years of El-Ni˜no during the period of study, NEMR was normal or excess during 23 years (except during the year 1951).

Source:S Balachandran, R Asokan and S Sridharan, Regional Meteorological Centre, Chennai.
Photo:-My Collections